February markets showed a shift in leadership as big tech struggled while international stocks, commodities, and defensive sectors gained momentum.
INVESTMENT OUTLOOK
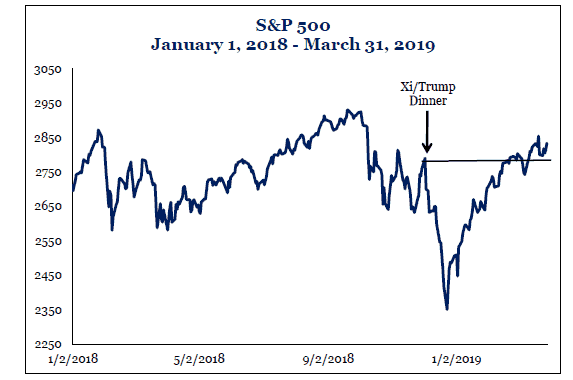
Global markets posted broad based gains across all major asset classes in the first quarter, which was the mirror image of the weak fourth quarter of last year. The U.S. bull market hit its 10-year anniversary. The S&P 500 had its best start to the year since 1998 notching double digit gains. All major asset classes recorded gains in the first quarter. The rebound can be attributed to the Federal Reserve dovish pivot early in the year. The Fed is on pause now and may not raise interest rates in 2019. Additionally, the Fed has indicated it intends to conclude the shrinking of its balance sheet by the end of this year. News that the U.S.-China trade talks were moving closer to a deal also contributed to the market snapback (Figure 1).
GROWTH
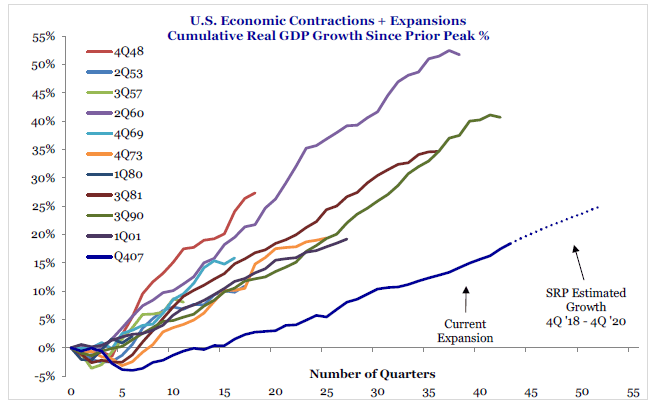
If the current economic expansion continues until July, it will officially rank as the longest in U.S. history (Figure 2). The current expansion has had a slower rate of growth than past expansions, which has prevented cyclical excesses in inflation and investments from building up.
Global growth slowed in the second half of
2018 and became less synchronized. Europe’s economy is struggling with slowing growth, high debt levels, negative interest rates, political unrest and Brexit uncertainty. China has experienced a slowdown. Recently, both the Eurozone and China have implemented new expansionary policies to stimulate growth. The combination of more accommodative policies from the Federal Reserve, Europe and China will push back against slower growth. China is a main driver of global growth. With China adding stimulus and the prospect of a trade deal between the U.S. and China likely, there is the potential for global growth to stabilize and potentially uptick in the second half of this year.
LABOR MARKETS
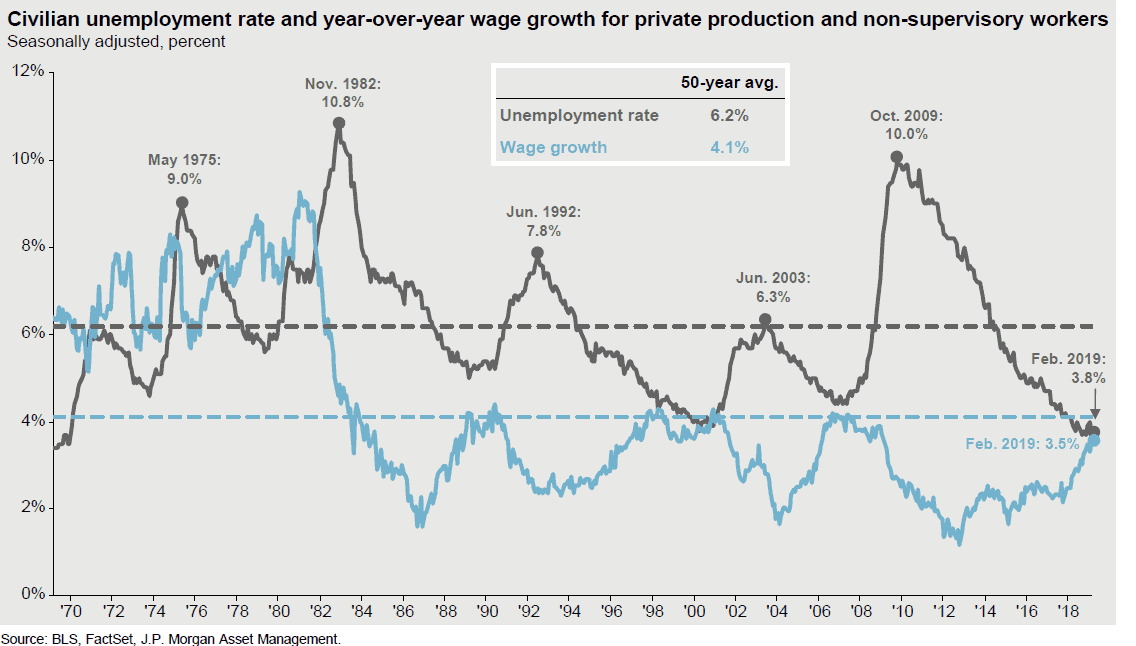
Economic growth in the U.S. has led to job growth and a decline in unemployment to 3.8%, the lowest since 1970. Wage growth has accelerated over the last two years due to a tight labor market with wages growing at a 3.5% annual rate, the best in over a decade (Figure 3). Productivity has ticked higher, which is good for growth and stable inflation.
CORPORATE PROFITS
Corporate profits were very strong in 2018 (+20%) driven by tax reform and a strong U.S. economy. S&P operating earnings are estimated to grow 4 to 5%, with revenues advancing 5% in 2019 (FactSet). Earnings estimates for 2019 have been reduced over last six months as global growth has softened.
VALUATIONS
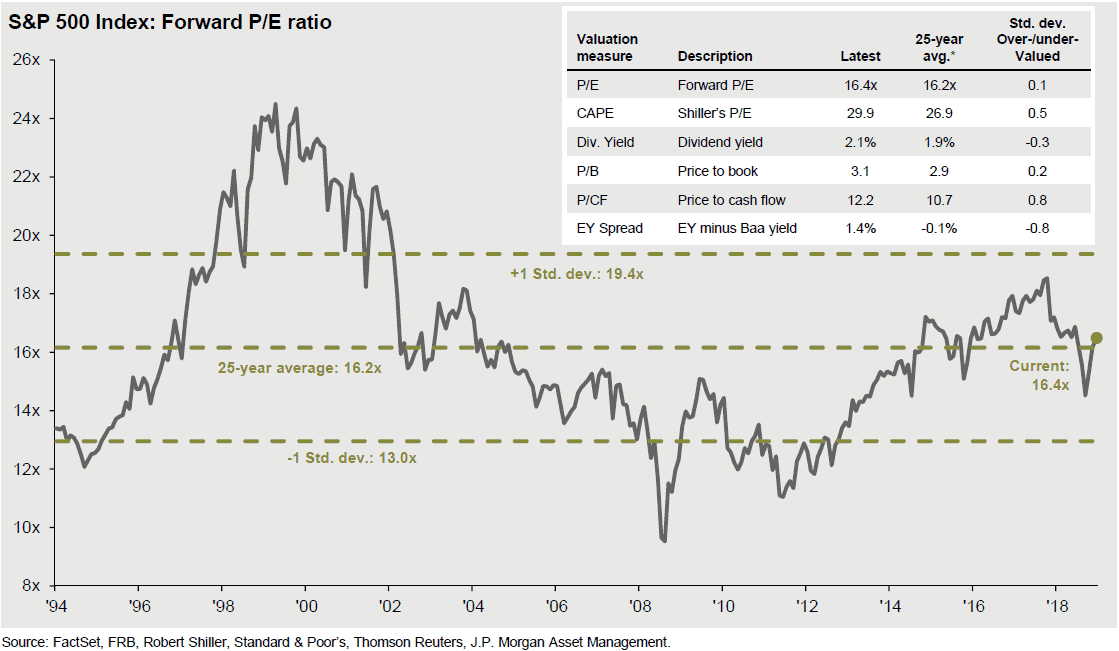
Stock valuations ended 2018 valued at 14 times forward earnings, which was attractive. After the strong first quarter market rally, valuations are now less compelling. The forward price-earnings ratio is 16.4 times operating earnings, which is in-line with the 25-year historical average of 16.2 times earnings (Figure 4). In low inflation and low interest rate environments, as currently exist globally, price-earnings multiples are typically higher than average.
INFLATION
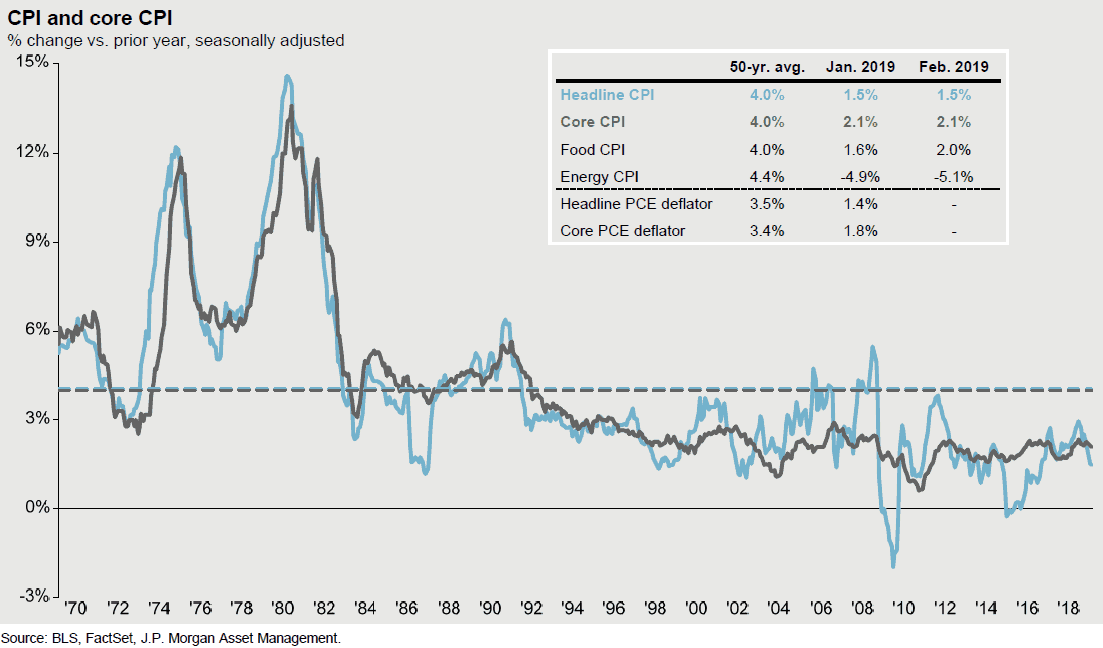
Consumer prices have been well contained. Inflation, as measured by the Fed’s preferred inflation measure (PCE), remains below the Fed’s target of 2% (Figure 5). Commodity and oil prices have been subdued due to plentiful supplies. Looking forward, inflationary pressures will likely remain contained even with wage growth running above 3% annually.
INTEREST RATES
The Fed’s pause in increasing interest rates is significant for the bond market and interest rates. Earlier this year, the three month T-bill interest rate exceeded the 10-year interest rate. This phenomenon has historically signaled a significant economic slowdown and a market correction. The timing, however, varies significantly and the equity markets have typically continued to rally after the phenomenon until finally adjusting to underlying fundamental economic data. In the second half of 2018, the combination of weaker global growth, U.S. – China trade conflicts, and the prospects of the Fed overdoing interest rate increases caused a major correction in markets late last year. With the Fed on pause for now, the prospects of monetary policy overkill have been reduced, which may increase the odds that the current expansion can be extended.
OUTLOOK
The U.S. economy is in late cycle as the current expansion is ten years old. Key factors that led to the market downturn in late 2018 have begun to dissipate. The Fed has paused its rate increases, U.S.-China trade talks are moving closer to a deal, China stepped up stimulus significantly to improve its growth, and the Eurozone economic data looks to be bottoming as the ECB becomes more accommodative. This combination of factors reduces the risk of recession over the next 6 to 12 months. We will be watching the economic data closely to determine if growth has bottomed and begins a modest upturn in the coming months.
INVESTMENT IMPLICATIONS: PORTFOLIO POSITIONING
The combination of slower global growth, an aging expansion and higher levels of political risk, leads us to favor more carefully balancing risk and return in portfolios. At the same time, we focus on opportunities created by rising divergences in a late cycle environment.
In our portfolio construction, we have reduced our overweight to stocks to neutral and our underweight to bonds as we have been moving to a more balanced positioning over the last 12 months. We have increased flexibility and liquidity by keeping our maturities short in the bond area. In equities, we have increased allocations to the U.S. due to stronger economic growth and strong corporate earnings. Global growth overseas weakened over the course of the past year and the U.S. dollar has been rising, leading us to further reduce international and emerging market allocations. In fixed income, we are focused on the U.S. and are avoiding international bonds due to lower interest rates where 30% of investment grade bonds still have negative interest rates. We have reduced significantly the allocation to credit in the bond area due to late cycle concerns where credit sector risk increases. We have reduced alternatives and increased cash equivalents, to increase liquidity and to take advantage of the rise in short-term interest rates that now provide competitive returns. We continue to diversify portfolios by incorporating diverse asset classes like gold, short-term investments, investment grade bonds and cash that act as portfolio diversifiers.
In a late cycle environment with low interest rates, forward looking asset class returns are lower than historical averages. Recent changes reflect a continuation over the last year toward less risk, a focus on higher quality investments and greater flexibility in our asset allocation positioning as we progress thru through this late cycle environment. In a late cycle environment, we continue to be watchful for signs of deterioration in economic and financial market data.
Overall, our dynamic asset allocation continues to be additive to returns, while continuing the construction of diversified, high quality global portfolios.
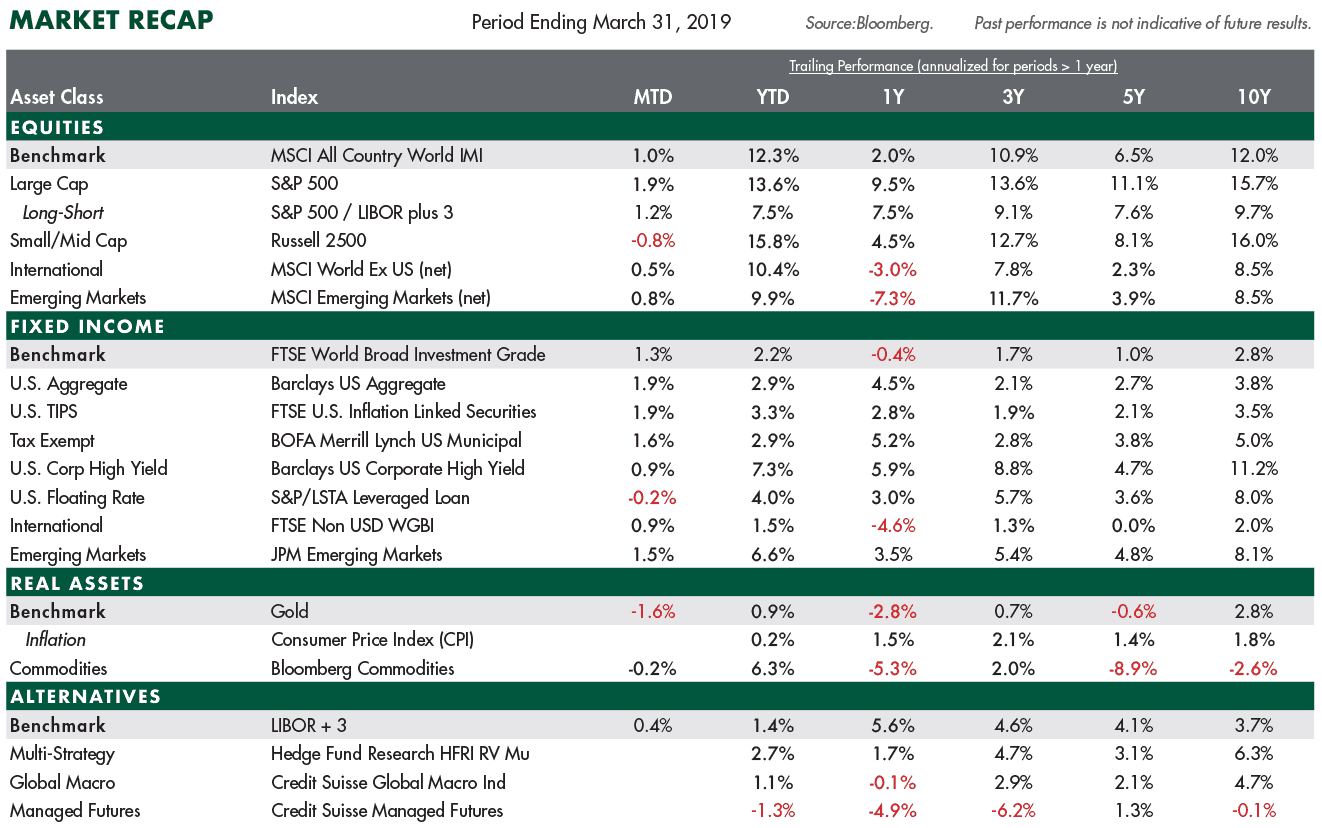
MARKET RECAP (MARCH 31, 2019):
- The first quarter generated strong gains across all major asset classes, which was a mirror image of the fourth quarter of last year. U.S. stocks had a robust start to the year as the S&P 500 gained 13%, its best start to the year since 1998. Global bonds gained 2.3% as interest rates moved lower on concerns of slowing global growth. International stocks trailed the U.S. as international developed equities gained 10.5% and emerging market equities rose 10.0%, both hampered by a stronger U.S. dollar.
- In terms of investing styles, growth outperformed value as stocks rebounded sharply in first quarter. Small cap outperformed large cap stocks for the quarter, although large caps did better than small caps in March.
- The yield on the 10-Yr. U.S. Treasury bond moved sharply lower in March to end at a 2.41% yield. The Barclay’s Aggregate Bond Index gained 2.6% year-to-date. In the bond credit sector, floating rate loans and high yield recovered from losses in the fourth quarter gaining 4.1% and 6.9% in the first quarter, respectively. Credit spreads narrowed as risk assets rebounded.
- WTI oil prices rebounded from weakness late last year to close at $60 per barrel. Commodities were mixed.
- Gold is a portfolio diversifier. Gold continued to trend higher gaining 0.9% year-to-date. Alternatives posted solid returns in the fixed income surrogate segment as bond yields moved lower and risk assets rebounded.
Related Articles