Learn why having a trusted wealth advisor can make all the difference in your financial future. In this video, we explain the true role of a wealth advisor, from investments to retirement, education, tax strategies, and estate planning.
Investment Outlook
Markets started the year on an optimistic note after a trade agreement, Federal Reserve interest rate cuts and improving macro data. The US stock market hit an all-time high in mid-February. Then two black swans emerged: the outbreak of the COVID-19 virus and an oil price war. As a consequence, global stock markets entered into bear market territory, the global economy was pushed into recession, U.S. Treasury interest rates dropped to new all-time low yields, and oil prices plunged.
Overview
-
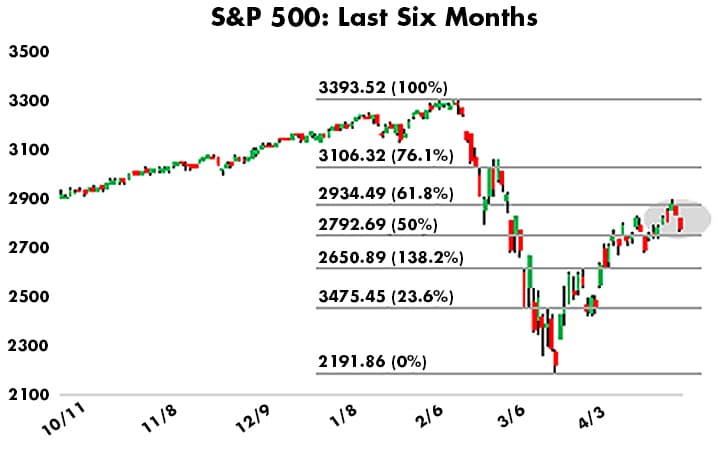
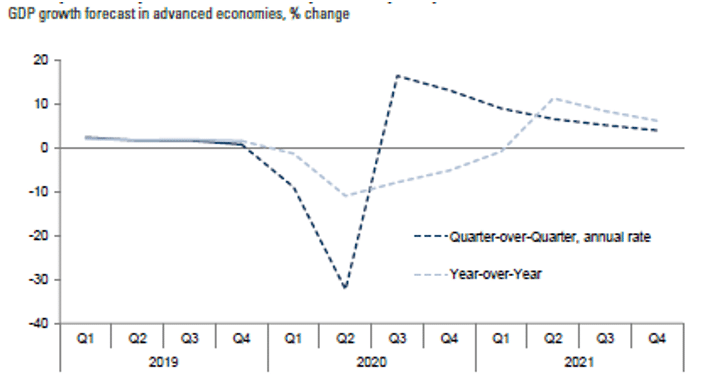
Figure 2: S&P 500 Index Global economic activity is in the midst of a deep contraction and recession as governments lock down economies and enact shelter-in-place policies to mitigate the spread of COVID-19 (Figure 1).
- The massive monetary and fiscal policy response to support the economy, combined with the gradual reopening of the economy will lead to a likely rebound in economic activity in the second half of this year.
- The stock market recovered over half of its sharp fall from record highs earlier in February as new cases of the virus have started to plateau and economies gradually reopen (Figure 2).
- We expect it will take an extended period of time for global GDP growth, employment and corporate earnings to return to the record levels reached in 2019. Risks remain that the lifting of restrictions are either delayed causing permanent damage to the economy or cause a second wave of cases.
- As we navigate this recession, we are focused on fundamentals and have a defensive approach, emphasizing quality, portfolio resiliency and liquidity. We are modestly underweight to equities, with a preference for high quality U.S. large cap companies. We have an overweight to investment grade bonds and gold for portfolio diversification.
COVID-19
The COVID-19 pandemic is an exogenous shock akin to a national disaster. The government mandated lock down has caused an unprecedented stop in economic activity. We know from history that these pandemic outbreaks eventually end and economic activity recovers. COVID-19 has caused the swiftest economic and stock market correction on record. The longest U.S. expansion of 11 years has come to an end. Global real GDP will likely contract 3% in 2020.
The global shutdown of economic activity to “flatten the curve” will be most severe in the second quarter with U.S. GDP estimated to contract at a 25 to 35% annualized rate. U.S. unemployment rose to 14% and will likely exceed 20% at the peak, the highest since the 1930s. As the economy begins to reopen, growth is forecasted to rebound in the second half of this year (Figure 1).
Fiscal and Monetary Policy
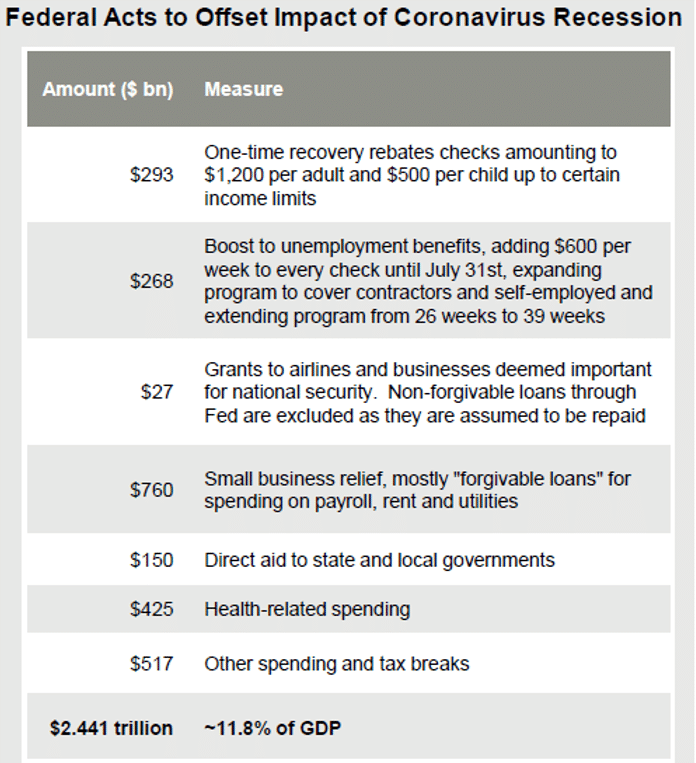
A massive, preemptive and unprecedented coordinated policy response to stabilize the economy and financial markets has been delivered by the Federal Reserve, Treasury and Congress. Extraordinary monetary and fiscal actions are also being delivered across the globe by policymakers. The Fed took swift, dramatic actions to restore liquidity in the fixed income markets by cutting interest rates to zero and restarting a broad QE program of purchasing U.S. treasury, agency mortgages, corporate and high yield securities. The Fed also enacted a wide range of credit facilities for the fixed income market and swap facilities for other central banks. Congress quickly passed the $2.2 trillion CARES Act to stabilize the economy during the lock down and recently added another $470 billion aimed at small businesses (Figure 3). The combined fiscal and monetary support totaled $9 trillion, which is over 40% of U.S. GDP. As of this writing, Congress is working on another relief bill that may total $2 trillion.
The unprecedented speed and scope of the U.S. policy response combined with the gradual reopening of the economy leads to our forecast of a rebound in the second half of 2020. However, our view is that it will take an extended period of time for global GDP growth, employment and corporate earnings to return to 2019 levels.
The Great Debt Super Cycle
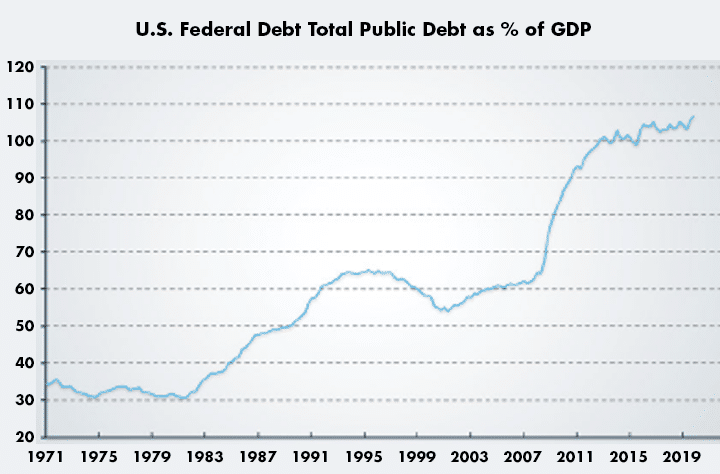
After the Great Financial Crisis (GFC) in 2008/09, policymakers responded with increased fiscal stimulus and easy money to offset the decline in demand. Accommodative monetary policy has led to a significant expansion in global debt that requires continued support from central banks to purchase that debt to keep interest rates low and encourage economic growth. The two main areas where debt has expanded are government and corporate sector debt. In the U.S., government debt has reached nearly 110% of GDP, up from 70% in 2007 (Figure 4). Likewise, U.S. corporate debt has risen to 47% of GDP, up significantly over the last decades. The US federal budget deficit was 4.6% of GDP at the end of 2019; the highest in history outside of a recession or war. The ability to continue to expand debt without negative consequences for overall growth is limited. The combination of high debt levels and deficits creates financial risk as the world faces the biggest economic downturn since the 1930s.
Risks
Uncertainties remain high and downside risks are predominant. Risks include debt deflation from a high level of debt at a time of negative economic growth, a move away from globalization and disruptions to supply chains. Many questions remain: How quickly will demand return? How will consumer behavior change? Can the lock down measures be lifted without triggering a major second wave of cases? A prolonged period of negative economic growth would lead to a rise in insolvencies, bankruptcies and job losses.
Stock Market Cycle Post COVID-19
The path of the US stock market is progressing through distinct phases since the virus outbreak.
Phase 1- Liquidation: The spread of the virus caused the quickest correction in the history of the stock market as the S&P 500 declined 34% (February 19th high to March 23rd low).
Phase 2 – Optimism: After a massive policy response, signs of new virus cases peaking and news of potential therapies, hope fueled a sharp rally in the S&P 500 as the market retraced over 60% of its prior decline (Figure 2).
Phase 3 – Realism: The next phase will likely take a long time and focus on the reopening of the economy, success of virus containment and a slow, uneven healing of the economy.
Business Cycles, Recessions, and the Stock Market
In a business cycle, an economic expansion is inevitably followed by a recession, where output declines after a period of growth. Recessions are typically caused by imbalances built up in the economy during an expansion that need to be corrected and are usually accompanied by the Federal Reserve tightening monetary policy. Typical signs of an imminent recession include rising inflation, interest rates, oil/commodity prices and jobless claims. An unexpected event shock like a war, financial or health crisis can also cause an economic downturn.
Recessions are typically short lived, averaging 11 months, and have ranged from six to 18 months. Bear markets and recessions often overlap, with the stock market leading and typically peaking seven months before the business cycle. Stocks usually lead on the way up and rally five months on average before the economy turns positive. The stock market typically bottoms when news is still bad, making sudden market timing moves, like moving to cash, highly risky. It’s usually better to stay invested to avoid missing the initial stage of the next bull market.
Looking Forward
Our view is it will take an extended period of time for economic activity, corporate earnings and employment to recover to 2019 levels. Typically, it takes over two years for earnings to recover to prior levels following a recession. Our base case is for an uneven, gradual recovery once the virus has peaked, restrictions are lifted and the economy is slowly reopened. The recovery is likely to be U or W-shaped (not V-shaped) as reopenings will be uneven across different regions and sectors, supply chains are restructured and consumer behavior changes. The risk to the base case is an L-shaped recovery due to an extended lock down or second virus wave, causing permanent damage to the economy. An extended period of negative growth could lead to a wave of corporate insolvencies and bankruptcies. The depth and duration of the economic downturn remains highly uncertain.
Investment Implications: Portfolio Positioning
Last year, we saw growth slowing in a late cycle environment and began to lower our equity allocation after being overweight for nearly 10 years. The disruption to the global economy from COVID-19 is unprecedented and uncertainty remains high. As we navigate this environment, we have positioned portfolios more defensively, emphasizing quality, portfolio resiliency and liquidity. We are modestly underweight to equities, with a preference for high quality U.S. large cap companies with strong cash flows and dividends. We have an overweight to investment grade bonds, cash and gold. We have cash and short-term investments as a buffer to protect capital and have dry powder to take advantage of opportunities when they arise.
Equities are in a bear market. The full hit to corporate earnings and global GDP is not determinable until the virus is contained and economies are reopened over a period of time. We prefer U.S. equities and are overweight large-cap versus small/mid-cap, emphasizing quality and lower credit risk. Global growth overseas was slowing pre-virus and risks abound (negative yields, credit risk, and populism). This has led us to an underweight in international equities and a neutral weight to emerging markets.
In fixed income, we now expect interest rates to remain low over the horizon as central banks provide support for the economy. We prefer U.S. investment grade where relative yields are higher and the Fed has provided a backstop to fixed income markets. Higher yields in the U.S. provide greater ballast for portfolios to hedge equity risk.
We have an allocation to U.S. Treasury Inflation-Protected Securities (TIPS) that are high quality assets and provide a hedge against rising inflation expectations. We are avoiding international investment grade bonds due to lower interest rates where $9 trillion of bonds have negative interest rates. We favor short-to-intermediate duration, high quality U.S. bonds. We remain cautious and underweight the credit sector due to higher leverage and credit risk.
We continue to incorporate diverse asset classes including gold, short-term investments, investment grade bonds, alternatives and cash that act as portfolio diversifiers and provide liquidity. We have an allocation to gold that has an improving profile and is an effective equity hedge against financial uncertainty and printing of money.
In an environment with record low interest rates, forward looking asset class returns are lower than historical averages. With the combination of a global recession and the pandemic, we expect volatility will persist until the virus is brought under control and the economy can be reopened. Overall, our dynamic tactical asset allocation continues to enhance returns and reduce risk.
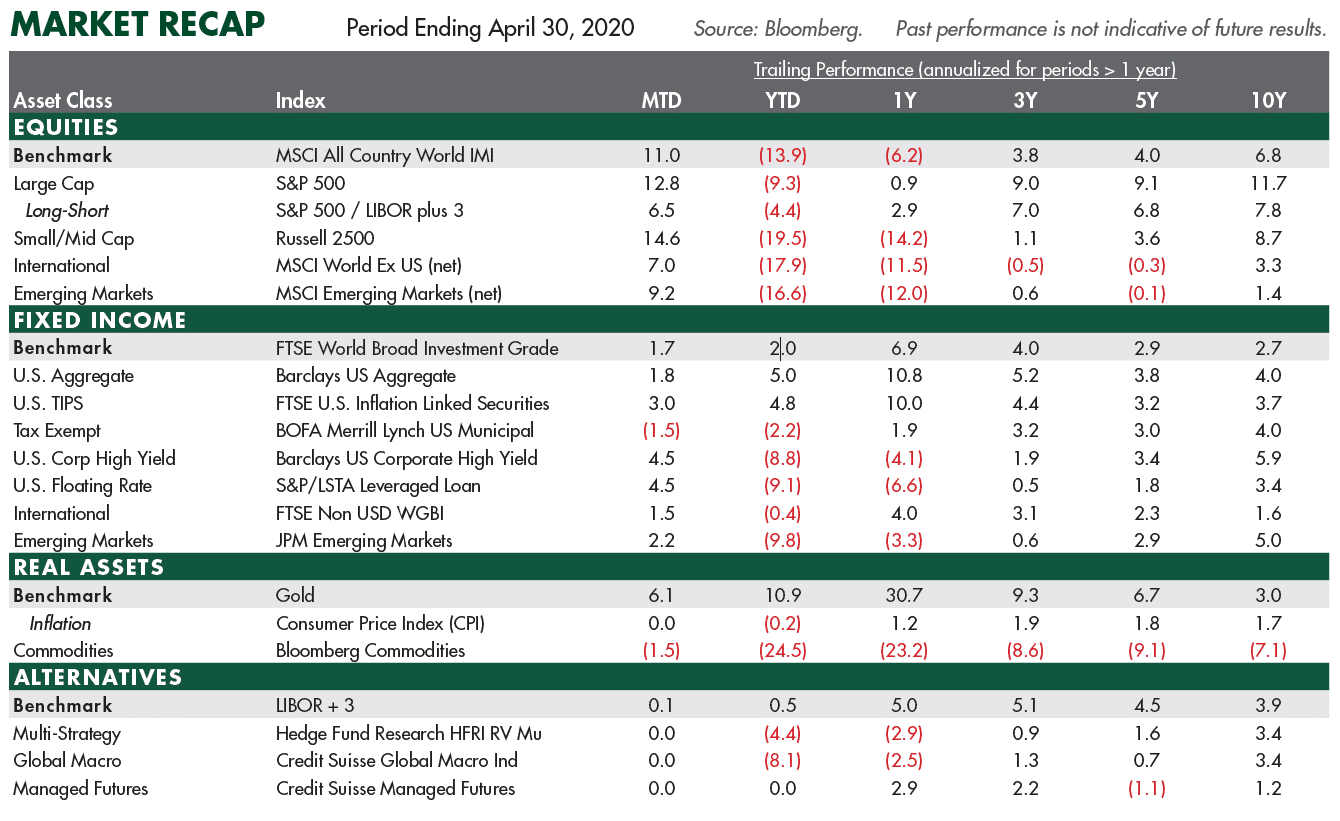
Market Recap (April 30, 2020):
- April was the strongest month for the S&P 500 since 1987 after an epic decline in late February to March. The S&P 500 gained 12% in April to cut the year-to-date loss to 9.3%. U.S. equities outperformed International developed equities and emerging market equities that fell 17.9% and 16.6%, respectively.
- In terms of investing styles year-to-date, growth outperformed value by a wide margin. Large-cap outperformed mid-cap and small-cap stocks.
- In fixed income, government bond yields dropped to all-time low yields. Non-government bonds underperformed as credit spreads gapped higher. Global bonds gained 2%. The yield on the 10-Yr. U.S. Treasury bond dropped sharply to a record low and ended at 0.64%. Floating rate loans and high yield sank as credit spreads widened with both declining 9%.
- WTI oil prices collapsed to $19 per barrel as a price war developed. The sharp fall in oil prices and the global economic shutdown led commodities to drop 24%.
- Gold broke out to the upside in 2019 on rising geopolitical concerns. Year-to-date, gold has soared 10.9%. Alternatives, in the fixed income surrogate segment, reversed earlier gains in the year as stresses developed in the fixed income markets.
Related Articles