In March, oil disruptions from geopolitical tensions lifted inflation expectations and pressured global markets, while energy gains and shifting rate outlooks kept investors focused on opportunities ahead.
Investment Outlook
The first half of 2019 saw major asset classes post their strongest gains in a decade. A number of records were set including the strongest January stock market rally since 1987, the lowest unemployment rate since 1969, the lowest German bond yield on record, record highs in U.S. equity markets and, at the end of June, the longest U.S. economic expansion on record.
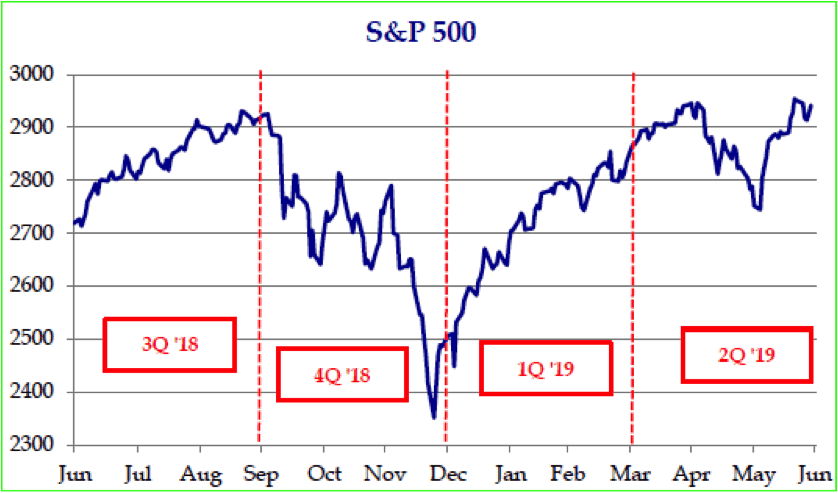
At the start of the year, the U.S. Federal Reserve paused its three-year-old program of tightening interest rates at a time when global economic growth was slowing. The major policy shift by the Fed in January boosted investor sentiment, and markets abruptly changed direction amid the shift in monetary policy after a weak fourth quarter last year (Figure 1). Global central banks are becoming more dovish as they lean toward cutting interest rates to offset slowing growth. As we enter the third quarter, the Fed is preparing the markets for a possible rate cut in late July and/or the fall. The Fed’s pivot to lower-rates-for-longer is extending the current economic cycle that has now become the longest on record as it enters its 11th year.
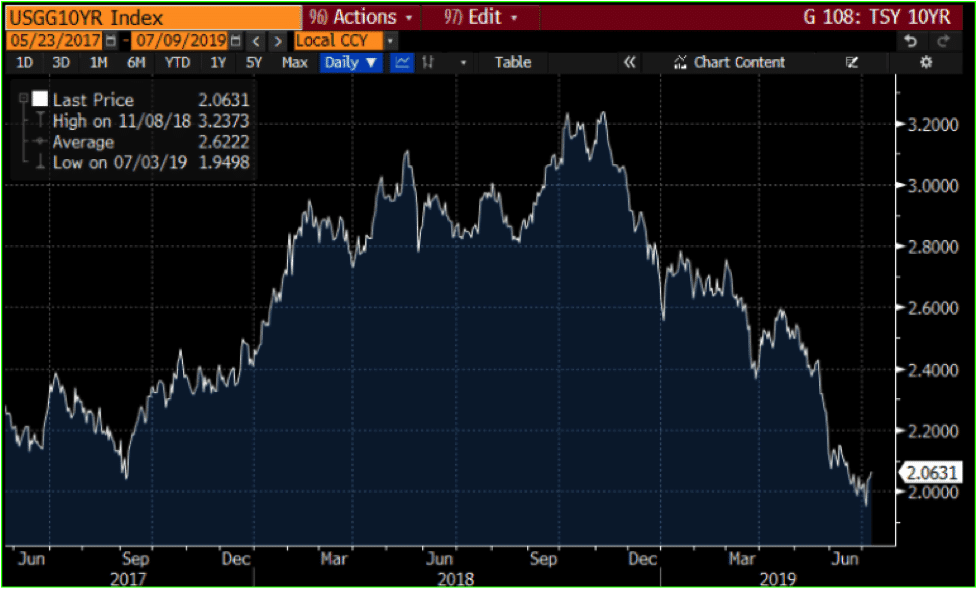
Overall, growth is slowing yet remains positive. The current period of lackluster growth and low inflation (below central bank targets) prompts global policy makers to favor low interest rates to support growth. Bond yields have plunged as the U.S. 10-year Treasury yield fell below 2%, the lowest in three years (Figure 2). More than $13 trillion in international sovereign debt now has negative interest rates. The combination of low inflation and low interest rates has led to flat and inverted yield curves, tight credit spreads and full equity valuations.
Markets were rattled in May as the U.S. implemented tariffs on $200 billion of Chinese goods. The trade dispute is causing global manufacturing activity to slow and represents the clearest risk to global growth. Recession risks have risen since the beginning of the year due to trade tensions, yet a recession is unlikely this year. Labor markets continue to be strong with an unemployment rate at a 50-year low of 3.7% and wages growing at a 3.4% annual rate (Figure 3). Household net worth is at an all-time record high. Corporate balance sheets are strong and earnings are slowing but continuing to grow.
Growth: Slow Global Growth, Recession Unlikely
Global growth has been slowing for the last 12 months. Heightened trade tensions and rising political uncertainties have hurt economic confidence. In response, fiscal and monetary policy makers in the U.S., Europe, Japan and China have added stimulus measures to push back against slower growth. Global central banks are moving to cut interest rates as growth slows and inflation remains subdued and below targets. Growth in the U.S. was 2.9% in 2018 and is likely to pull back to roughly a 2% pace.
A U.S. economic recession appears unlikely in the next 12 months, unless there is a major shock to the system. The risk of a recession is low due to two reasons. Growth in this economic expansion has been slower than usual which has not led to the typical excesses that occur in an overheated economy. Second, the Federal Reserve has stopped raising interest rates and is likely to cut interest rates one to two times in 2019. Lower interest rates will stimulate growth and is likely to allow the economy to continue to grow for a longer period.
Labor Markets: Strong Growth with Moderate Wage Gains
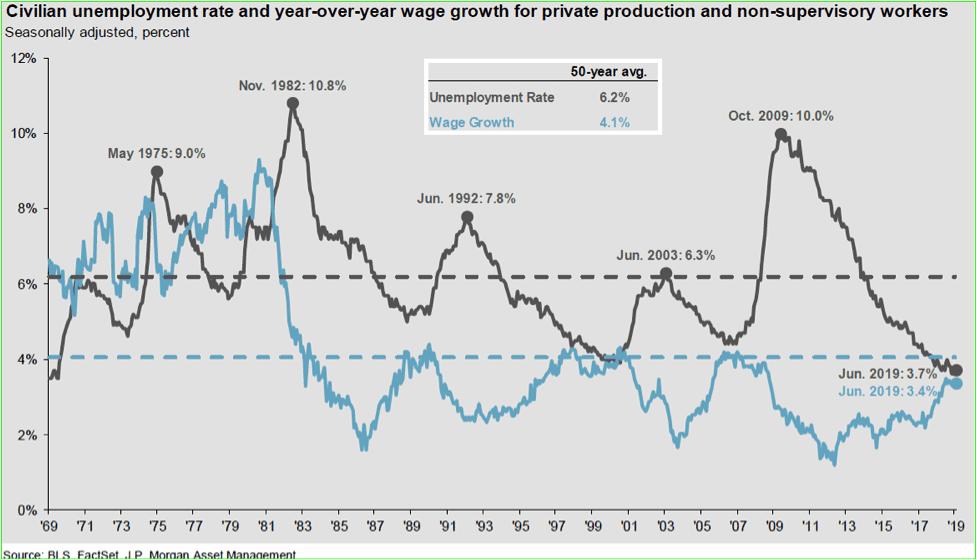
Employment growth began slow, but continues to be solid in a tight labor market. Wages are climbing 3.4% annually for non-supervisory workers, which is below the 4% rate that historically causes inflation issues. The unemployment rate is 3.7%, which is the lowest rate in 50 years (Figure 3). A strong labor market supports strong consumer spending, which is important as the consumer accounts for 67% of the U.S. economy. Productivity growth has improved due to new technologies, which leads to stable inflation and higher growth.
Corporate Profits: Slow but Positive
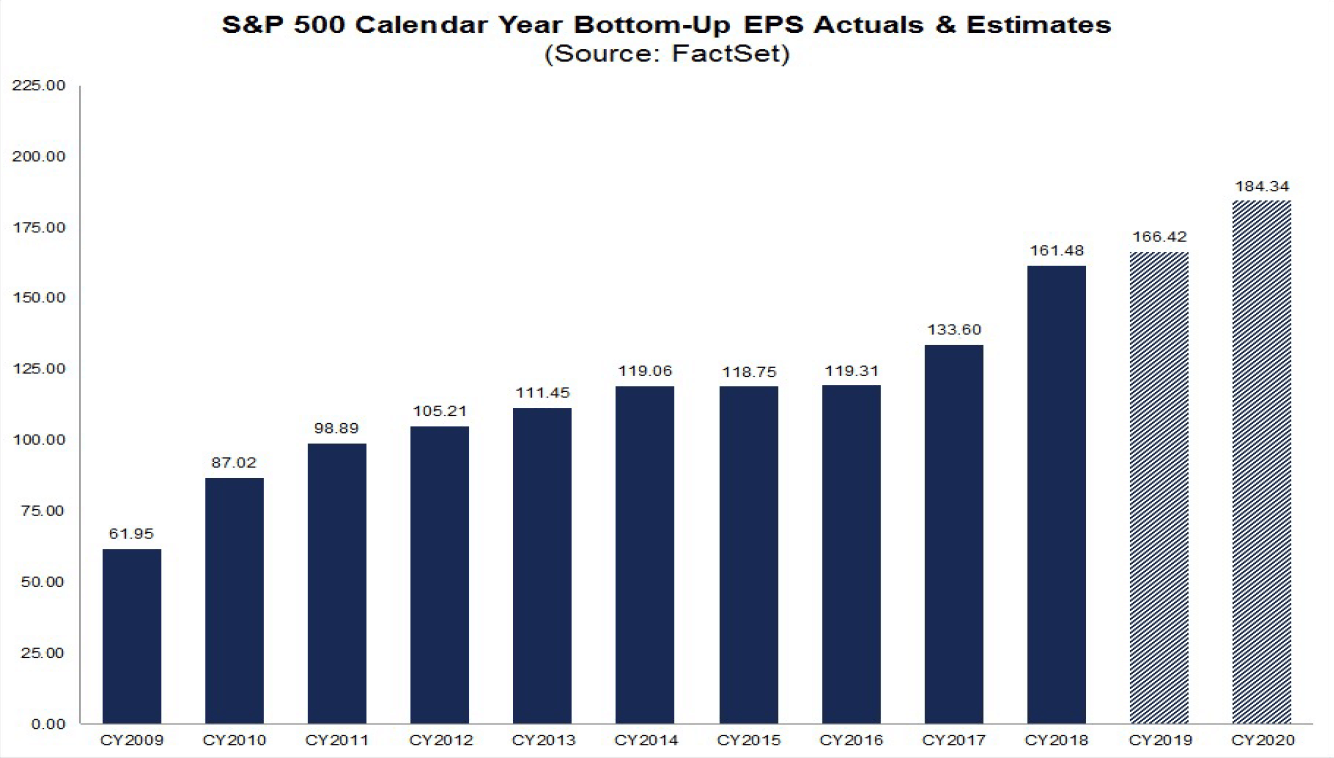
Profit growth was extremely strong in 2018 (+20%) driven by tax reform and stronger U.S. growth. In 2019, the profit cycle is slowing to a 3-4% year-over-year rate (Figure 4). Profits are likely to be positive growing at a single digit rate over the balance of 2019 into 2020, aided by moderate wage gains and lower interest expense, but trade frictions and slower overseas growth remain headwinds.
Valuations: Full to Somewhat Elevated
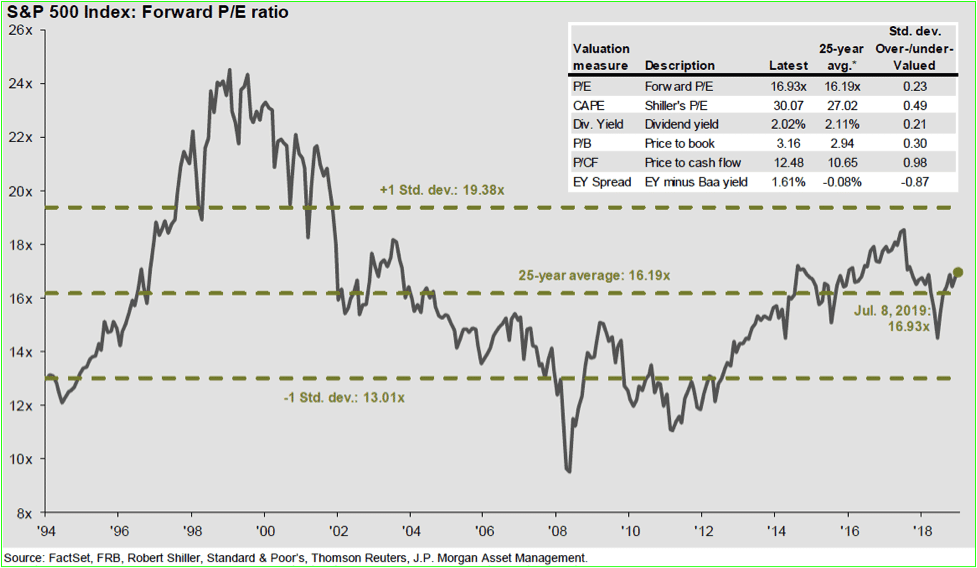
Lower global interest rates create higher demand for equities and support higher valuations. The forward operating price-earnings ratio is 16.8 times earnings and is hovering around the 5-year historical average of 16.5 times earnings and the 25-year average of 16.2 times earnings (Figure 5). By other metrics, however, the stock market is fully, if not richly, valued and higher equity prices will need to be driven by higher earnings.
Inflation: Remains Benign
One of the big surprises in this long expansion has been the persistently low inflation, which has recently moved further down due to softening global economic growth and macro uncertainties. Looking forward, this combination is prompting the Fed to become more dovish in leaning toward lowering interest rates.
Interest Rates: Lower, Not Higher,
in 2019
Interest rates plunged in recent months as the U.S. 10-year Treasury yield fell over 100 basis points from 3% to 2%. This caused the yield curve to invert (short rates higher than long-term interest rates) in the one to ten-year maturity range. Overseas interest rates are putting downward pressure on U.S. rates as the German 10-year now yields a record low negative 40 basis points (-0.40%). However, investors’ expectations of easing by the Federal Reserve appear excessive given the low near-term risks of a recession. The Fed is likely to cut interest rates 1 to 2 times in 2019 to address the inverted yield curve.
Outlook
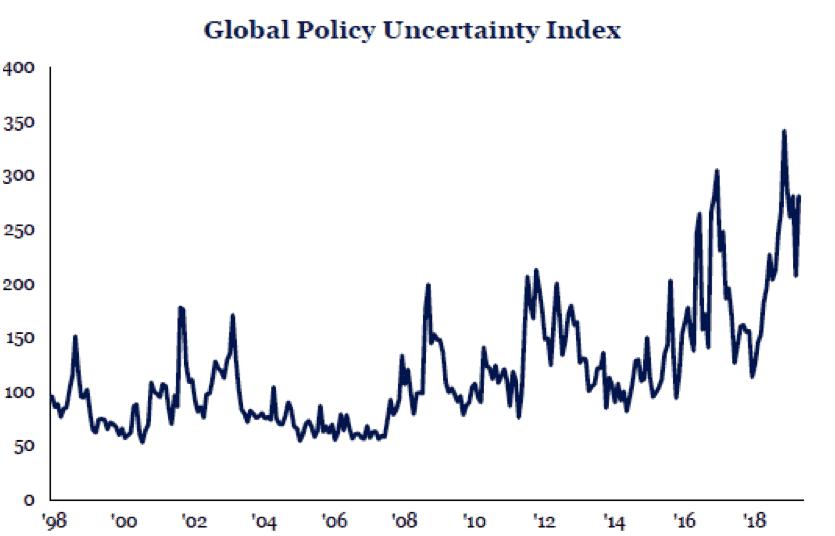
The U.S. economy is transitioning to the late stage of the cycle. We are more cautious on our global growth outlook as trade frictions lead to a wider range of potential outcomes for the economy and markets. Trade tensions caused global manufacturing PMIs and growth to slow over the last year. Geopolitical frictions and macro uncertainties (Figure 6) remain elevated at a time when asset prices for stocks and bonds are near highs. U.S. growth is slowing, yet there are few signs of overheating or financial bubbles/imbalances that have historically been the catalysts that end expansions. The global dovish shift in monetary policy by global central banks toward lower interest rates will help soften the global slowdown and lengthen the long expansion. Overall, this leads us to become more cautious and stay close to our long-term strategic target allocations.
INVESTMENT IMPLICATIONS: Portfolio Positioning
Against the backdrop of a late cycle environment, slower global growth, higher macro uncertainties and asset prices that are uniformly higher, we are sticking close to our long-term strategic target allocations.
We moved to a more balanced portfolio positioning by reducing our overweight to stocks to neutral and increasing our bond allocation over the last 12 months. We emphasize flexibility and portfolio resilience to structure portfolios that can prosper in a wide range of economic and market scenarios.
We remain positive on U.S. equities and have increased allocations due to stronger U.S. economic growth, corporate earnings and policy. Global growth overseas has weakened in Europe, Japan and China, and policy risks abound (Brexit, negative yields, credit risk, populism). This led us to further reduce allocations to international equities. We are market weight emerging market equities due to favorable relative valuations and long-term growth fundamentals while recognizing the risk from a China slowdown.
In fixed income, we are focused on the U.S. and are avoiding international bonds due to lower interest rates where $13 trillion of investment grade bonds have negative interest rates. We have reduced the allocation to the credit area due to tight spreads and late cycle concerns that see credit sector risk increase.
We continue to diversify portfolios by incorporating diverse asset classes including gold, short-term investments, investment grade bonds, alternatives and cash that act as portfolio diversifiers and provide liquidity.
In a late cycle environment with low interest rates, forward looking asset class returns are lower than historical averages. Recent changes reflect a continuation over the last year toward a more neutral balance, a focus on higher quality investments and greater flexibility as we progress through this late cycle environment. In a late cycle backdrop, we continue to be watchful for signs of deterioration in economic and financial market data.
Overall, our dynamic asset allocation continues to be additive to returns, while continuing the construction of diversified, high quality global portfolios.
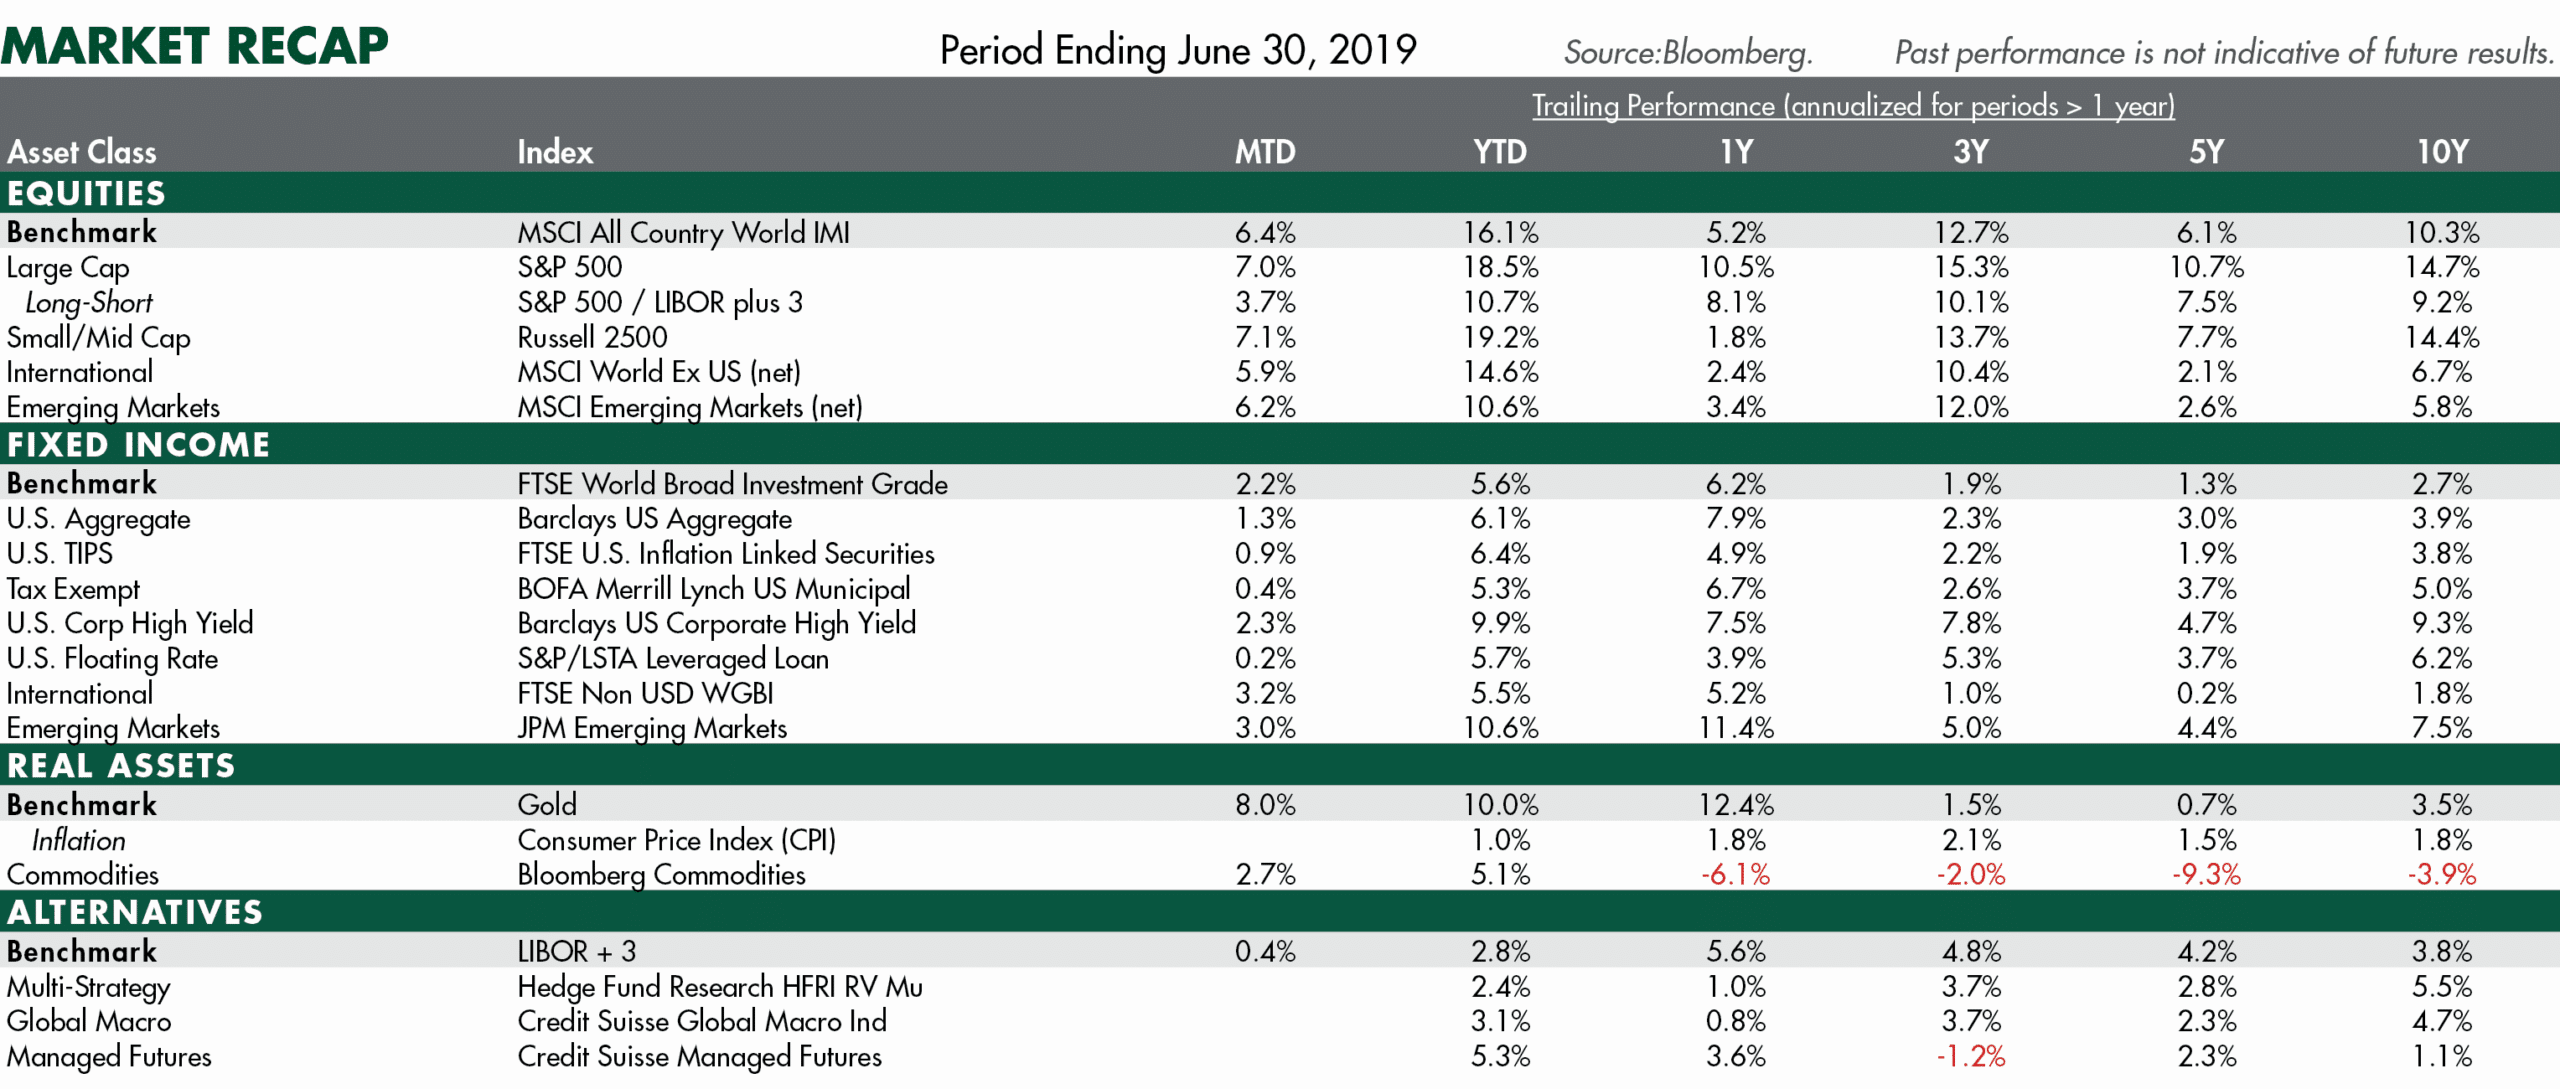
MARKET RECAP (June 30, 2019):
In the first half of 2019, the broad asset classes posted strong gains, the best in a decade. Global equity markets rebounded sharply in June reversing the correction in May.
For the first half, U.S. equities led as the S&P 500 gained 18.5%. The U.S. outperformed international stocks as international developed equities gained 14.6% and emerging market equities rose 10.6%, both held back by a stronger U.S. dollar and higher exposure to trade tensions.
In terms of investing styles, growth outperformed value year-to-date. Mid-caps outperformed both large-caps and small-caps.
Global bonds posted robust gains of 5.6% as interest rates dropped sharply on concerns of slowing global growth and future interest rate cuts. The yield on the 10-Year U.S. Treasury bond plunged to 2.0% after being above 3% earlier in the year. In the bond credit sector, floating rate loans and high yield bonds recovered from losses in the fourth quarter and have gained 5.7% and 9.9% year-to-date, respectively. Credit spreads have tightened year-to-date across the credit sector as interest rates and defaults remain low.
WTI oil prices jumped $13, year-to-date, to $58 per barrel. Commodities are higher by 5% for the year primarily due to the rise in oil prices.
Gold is a portfolio diversifier. Gold was the top asset class gainer in the second quarter and is 10.0% higher for the year. Year-to-date, alternatives posted solid returns in the fixed income surrogate segment as bond yields moved lower and risk assets rebounded.
Related Articles