Learn why having a trusted wealth advisor can make all the difference in your financial future. In this video, we explain the true role of a wealth advisor, from investments to retirement, education, tax strategies, and estate planning.
INVESTMENT OUTLOOK
After entering 2020 with positive momentum, the global economy and financial markets were rocked by the spread of the COVID-19 pandemic. As the health crisis spread across the globe, governments were forced to lockdown their economies causing a very deep contraction and recession. Financial markets declined precipitously, causing the fastest bear market in history. Policy makers responded with extraordinary monetary and fiscal support to cushion the impact of the contraction, which led to an equally remarkable recovery in financial markets (Figure 1).
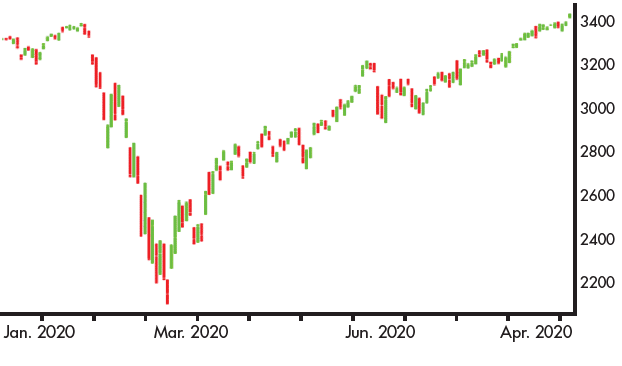
Both the S&P 500 and the NASDAQ recently made new record highs. Volatility fell considerably and credit spreads in the fixed income market narrowed.
OVERVIEW
- Our base case is for a gradual, uneven restart and recovery of the global economy. The range of potential economic scenarios over the balance of 2020 and into next year is unusually wide and uncertainty remains high.
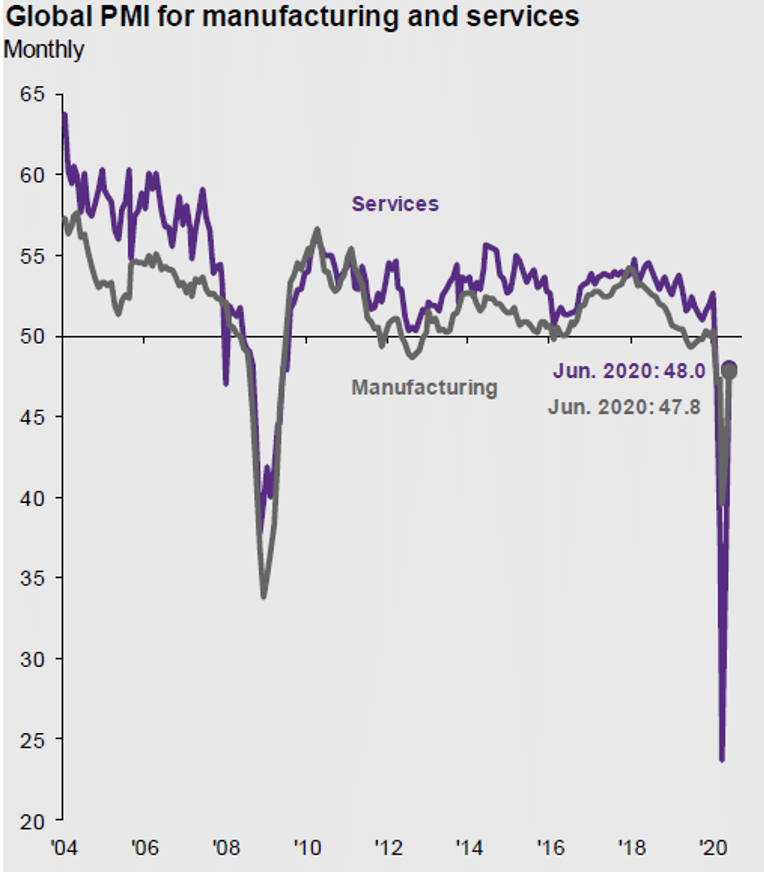
Figure 2: Recovery in Global PMI - A nascent, synchronized global recovery has begun (Figure 2). The economic recovery will depend on the path of the virus, ongoing policy responses and changes in consumer/corporate behaviors.
- The extraordinary rally in equity markets since the low on March 23, has created a chasm between asset prices and the real global economy in the early stages of recovering from the ongoing pandemic.
- In this environment with uncertainty high, building portfolios that are resilient and can weather a range of outcomes is key. We use portfolio diversifiers to lower risk in portfolios.
ECONOMY
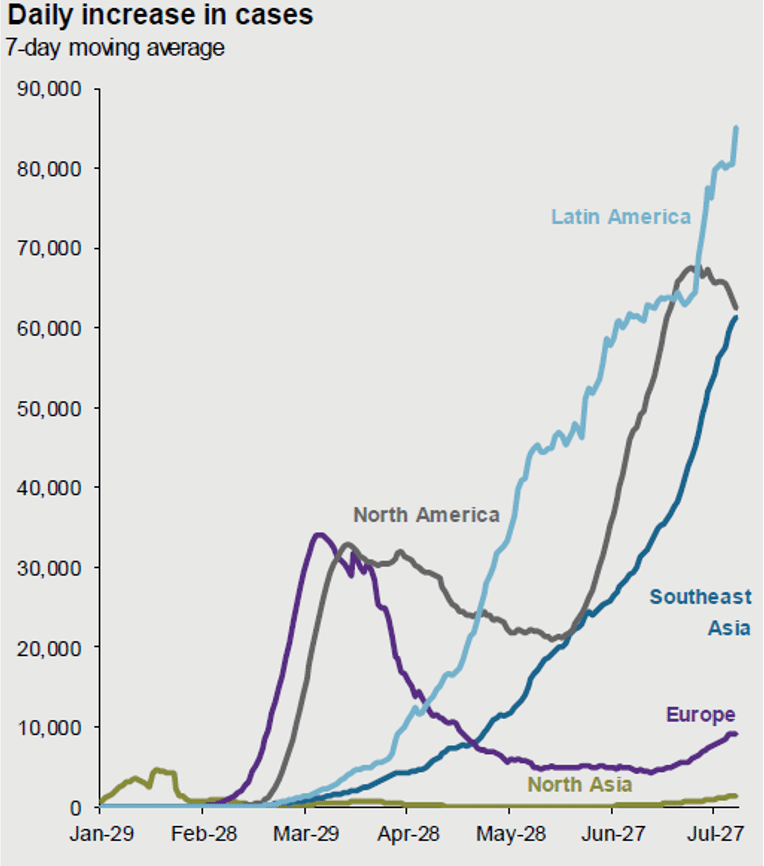
Lockdowns and social distancing caused a severe and transitory economic “depression” with second quarter GDP likely declining over 30%. S&P 500 earnings for Q2 are expected to be down over 40% year-over-year. Earnings are not likely to reach 2019 peak earnings levels until 2022. The global economy looks to have hit a trough in April and is at the beginning of a nascent synchronized recovery. Our base case is for a bumpy and gradual recovery as different economies and sectors reopen at different speeds. The pandemic has been subsiding in Europe while continuing to spread in the U.S. and emerging markets (Figure 3). The market appears to be optimistic on progress of vaccine development. It is unlikely a vaccine will be available until 2021.
FISCAL AND MONETARY POLICY
The Federal Reserve took dramatic action stating it will do “whatever it takes” to support the economy. The Fed has indicated it has no intention of raising interest rates anytime soon and stated interest rates will be “even lower for even longer”. They are targeting an increase in inflation to 2%, but so far have avoided explicit yield control or negative interest rates. A significant change is the Fed, along with other central banks, has vastly expanded their roles from controlling inflation and being a lender of last resort to being an investor of last support and capping interest/credit costs. European leaders recently agreed to a massive €750 billion recovery plan that creates European bonds. The combined U.S. monetary and fiscal support totals over $9 trillion, which is over 40% of GDP. Congress may pass a fifth support package totaling $1.5 to 1.8 trillion by the end of August.
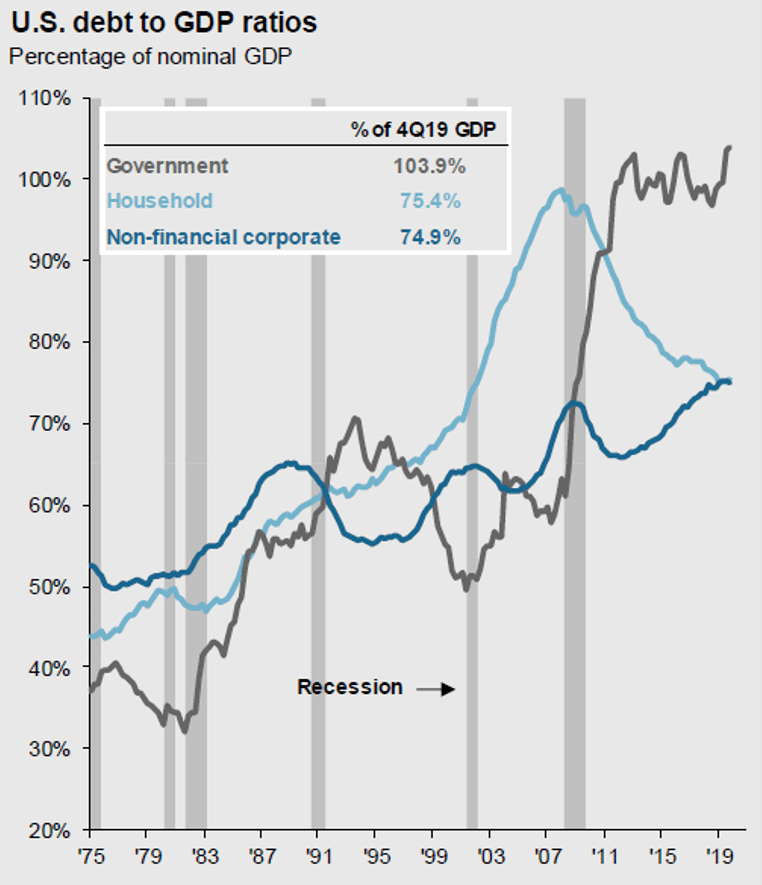
Global economies and the stock market continue to benefit from the extraordinary fiscal and monetary support. It has been estimated that global central banks have injected over $17 trillion in liquidity into the financial system, while global fiscal support by governments has totaled over $11 trillion according to the IMF. As a result, global government debt is increasing and is forecasted to exceed 100% of global GDP for the first time in history (Figure 4). The pandemic will eventually end while the debt will remain, which will be a headwind for future growth.
STOCK MARKET PHASES POST COVID-19
The path of the US stock market is progressing through distinct phases since the virus outbreak.
Phase 1- Liquidation: The spread of the virus caused the quickest correction in the history of the stock market as the S&P 500 declined 34% (February 19th high to March 23rd low).
Phase 2 – Optimism: After a massive policy response, new virus cases peaking and news of potential therapies, hope fueled a sharp rally in the S&P 500 to new highs (Figure 1).
Phase 3 – Realism: The next phase will likely take a long time and focus on the reopening of the economy, success of virus containment and a slow, uneven healing of the economy.
VALUATIONS ARE ELEVATED
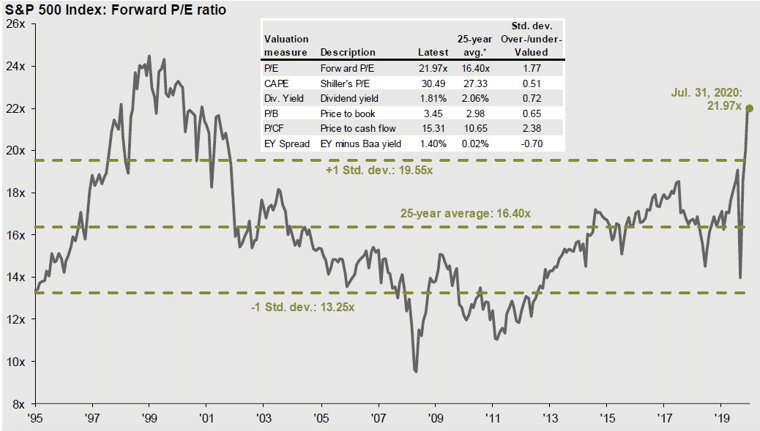
With consensus earnings estimates of $129 for 2020 and $164 for 2021 (FactSet), price-earnings ratios are 25 and 20 times earnings, respectively (Figure 5). The stock market capitalization to GDP ratio (a favorite indicator of Warren Buffet) is at a record high. After the sharp rally of equity markets since the March low, there is a wide gap between stock prices and the fledging recovery of the real economy. The question investors are contemplating is, “What explains the disconnect between asset prices and the real economy?”
Stock prices are a discounting mechanism that look beyond current events to the future, typically declining before economic slowdowns and rising before signs of recovery. Clearly, asset prices are looking across the valley of the current contraction and anticipating a relatively quick recovery. This optimistic view by investors is being driven by a focus on signs of a pickup in the global economy, rising hopes for a vaccine, and Fed support.
GOLD
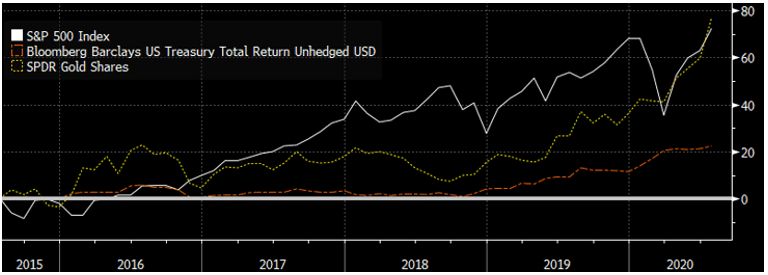
With uncertainty being elevated, portfolio diversifiers play a key role in lowering risk in portfolios. Gold has historically been a good hedge against uncertainty and declines in equity markets. Gold is also a viable hedge both against inflation in strong growth periods and against deflation in weak periods where the Fed is printing money. Over the last five years, gold has outperformed both the S&P 500 and safe haven Treasuries (Figure 6).
NOVEMBER 3RD ELECTION
The current odds have shifted significantly since the beginning of the year, as the virus spread and recession unfolded. Although November is a long way away in political terms, the current odds favor a possible Democratic sweep and a Biden Administration. Biden has proposed restoring the 39.6% tax rate on income over $400,000, taxing capital gains at ordinary rates on incomes above $1 million and repealing the step-up in cost basis on death. For corporate taxes, he is proposing increasing the top rate to 28% from 21%. In sum, the outlook is that taxes would likely go up on top taxpayers and corporations. Also, spending would likely increase in areas of health care, infrastructure, education, clean energy and housing, but not at the level proposed, which is double the proposed new revenue. With the current size of the budget deficit, taxes in the U.S. are likely to increase in the future no matter which party wins in November.
LOOKING FORWARD
Looking out over the next 12 months, our base case is for a gradual, uneven recovery as global economies are restarted. Our view is it will take until 2022 for economic activity, corporate earnings and employment to recover to 2019 levels. Historically, it takes over two years for earnings to recover to prior levels after a recession, and four plus years for employment to recover. Geopolitical risks are rising with tension between the U.S. and China. A full recovery will not happen until a vaccine is developed and the timing of a vaccine being available on a global scale is unknown.
INVESTMENT IMPLICATIONS: PORTFOLIO POSITIONING
While our base case sees a gradual recovery in global growth over the next 12 months, the range of paths and potential outcomes is wider than normal and remains uncertain. As we navigate this environment, we have an emphasis on quality, portfolio resiliency and liquidity. We favor high quality U.S. large cap companies with strong market positions, cash flows and dividends. Portfolio diversifiers are important in hedging downside risks in portfolios. High quality U.S. bonds with duration provide ballast in portfolios. Inflation-linked bonds and gold provide a hedge to a future inflation surprise due to excessive monetary creation. We have short-term investments for dry powder to take advantage of opportunities. Our focus is building portfolios that are resilient and well-diversified to weather a range of potential outcomes.
We are modestly underweight to equities with a strong overweight to large cap U.S. equities, coupled with an overweight to investment grade bonds and gold. We prefer U.S. equities and are overweight to large-cap versus small/ mid-cap emphasizing quality and lower credit risk. The U.S. has had a bold policy response. We are underweight in international equities and emerging markets. With the recent weakening of the dollar and substantial European recovery program, we have recently increased our international exposure.
In fixed income, we expect interest rates to remain low over the near-term horizon as central banks provide support for the economy. We prefer U.S. investment grade bonds that have relatively higher yields, providing greater ballast for portfolios to hedge equity risk and have a Fed policy backstop. We have an allocation to U.S. Treasury Inflation-Protected Securities (TIPS) that are high quality assets and provide a hedge against rising inflation expectations. We remain underweight in the credit sector due to higher leverage and credit risk.
We continue to incorporate diverse asset classes including gold, short-term investments, investment grade bonds, alternatives and cash that act as portfolio diversifiers and provide liquidity. We have an allocation to gold that is an effective equity hedge against financial uncertainty and the printing of money.
In an environment with record low interest rates, forward looking asset class returns are lower than historical averages. We expect volatility will persist as the reopening will be bumpy and a vaccine is at least 6 to 12 months away. Overall, our dynamic tactical asset allocation continues to enhance returns and reduce risk.
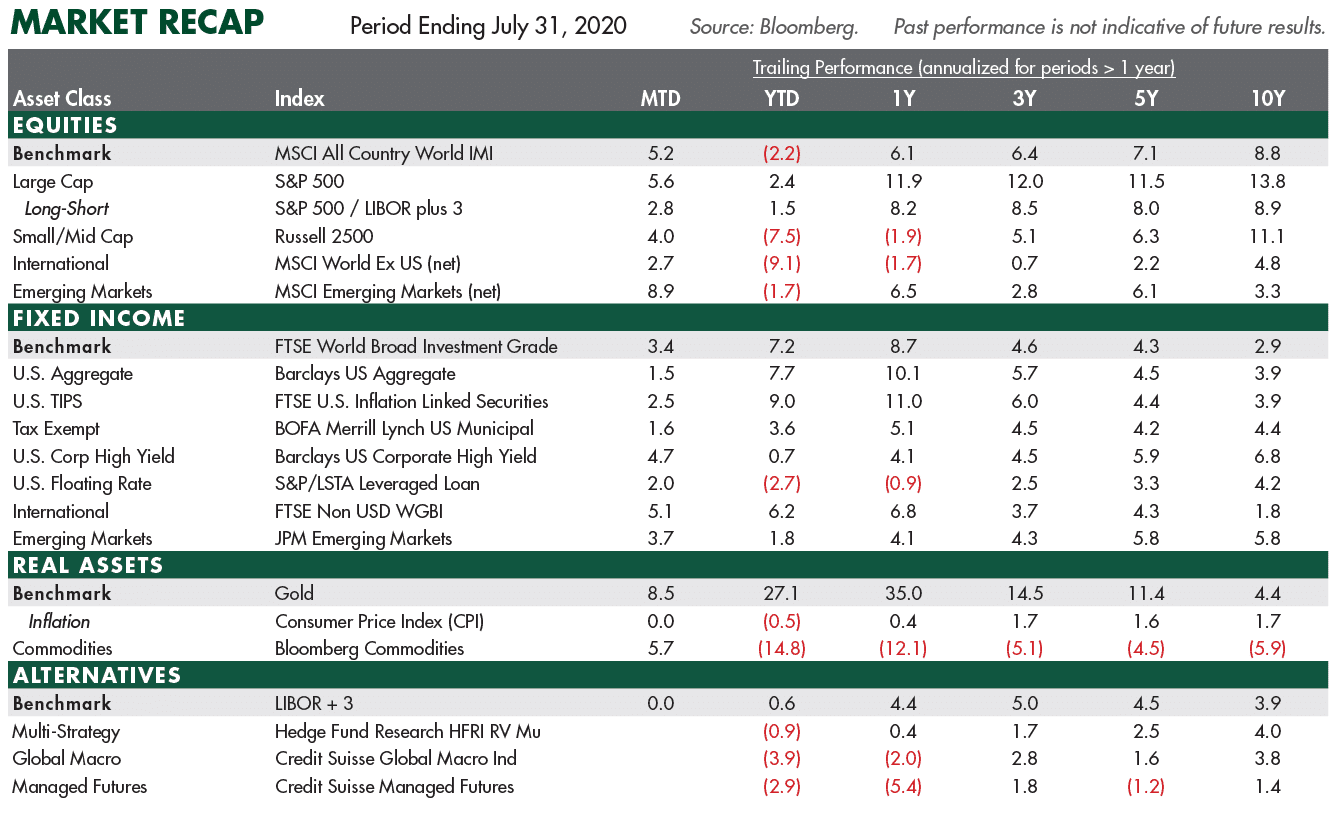
MARKET RECAP (JULY 31, 2020):
- Equity markets have had a dramatic recovery from March lows. The S&P 500 gained 5.6% in July and is now higher by 2% in 2020.
- Year-to-date, U.S. large cap equities outperformed International developed equities and emerging market equities that fell 9.1% and 1.7%, respectively. The MSCI All Country World Index (ACWI) is lower by 2.2% in 2020. Recently, International and emerging market equities have improved relative to U.S. equities as the dollar has weakened.
- In terms of investing styles year-to-date, growth outperformed value by a wide margin. Large-cap outperformed mid-cap and small-cap stocks.
- In fixed income, bonds performed surprising well as government bond yields dropped to all-time record low yields. Government bonds outperformed as credit spreads rose from the beginning of 2020. Global bonds gained 7.2%. The yield on the 10-Yr. U.S. Treasury bond dropped sharply to near record lows and ended at 0.54%. Floating rate loans and high yield sank as credit spreads widened due to the pandemic and bounced back after the Fed created support facilities.
- WTI oil prices collapsed to $19 per barrel due to a price war earlier in the year but have rebounded to $39. The sharp fall in oil prices and the global economic contraction led to a 15% decline in commodities.
- Gold broke out to the upside in 2019 on rising geopolitical concerns. Year-to-date, gold has soared 27%, the best performing asset class. Alternatives, in the fixed income surrogate segment, reversed earlier gains in the year as stresses developed in the fixed income markets.
Related Articles