May saw markets rebound as tech and consumer stocks surged, offsetting bond losses and debt concerns. International equities outpaced U.S. gains, while gold cooled but remained a top performer.
Investment Outlook
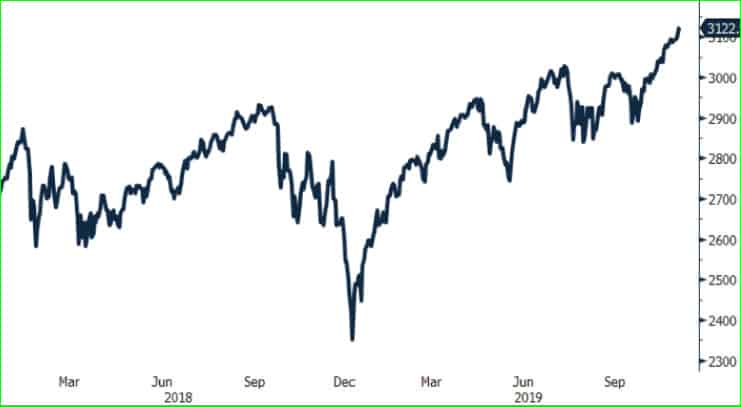
Investments returns have been very strong in 2019. All major asset classes have posted robust returns year-to-date with many posting their strongest gains in a decade. U.S. equity markets have recently hit record highs and broken out above a narrow trading range that they were stuck in for nearly two years (Figure 1). The key drivers have been a dovish pivot by Global Central Banks to a new easing cycle to support the expansion, the recent lull in trade tensions and diminished risks of a no-deal Brexit. Lower interest rates have boosted financial assets yet, in general, have not caused a re-acceleration in the real economy. For equity markets to continue to march higher, fundamentals in the real economy must improve along with corporate profits.
Growth
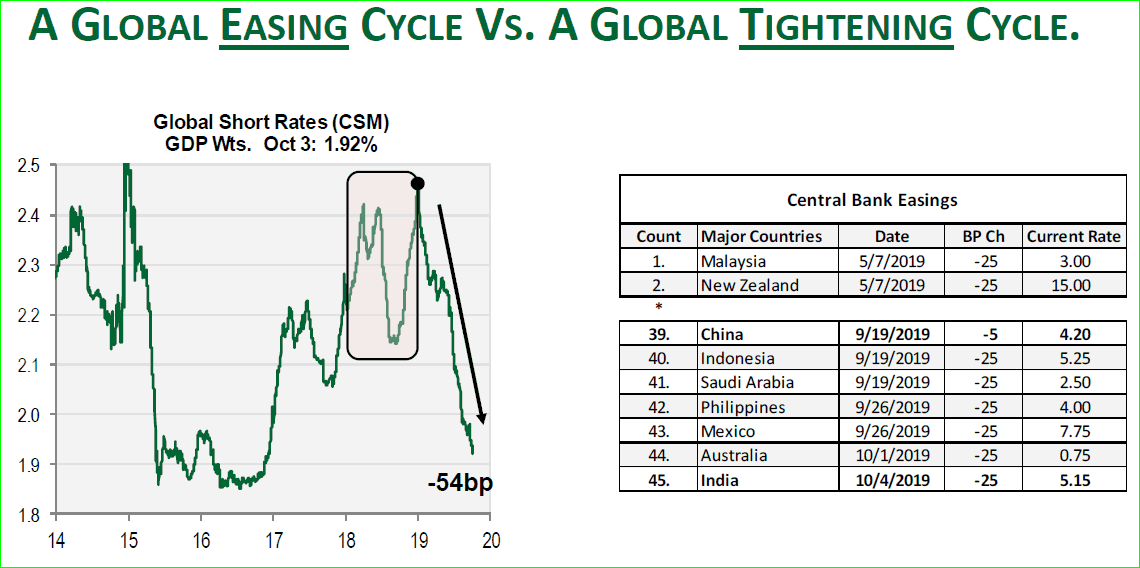
Global growth started to decelerate in early 2018, followed by global trade tensions causing manufacturing activity to slow with several regions dipping into contractionary territory (below 50). Global Central Banks have responded by easing monetary policy with the aim of extending the current economic expansion. Almost every central bank across the globe is in an easing mode (Figure 2).
The Federal Reserve lowered interest rates for the third time this year in October and signaled that it is on hold for now with a higher hurdle for future rate cuts. Markets are now expecting only one 25 point reduction in rates by the Fed over the next 12 months. Importantly, the yield curve is no longer inverted in the U.S.
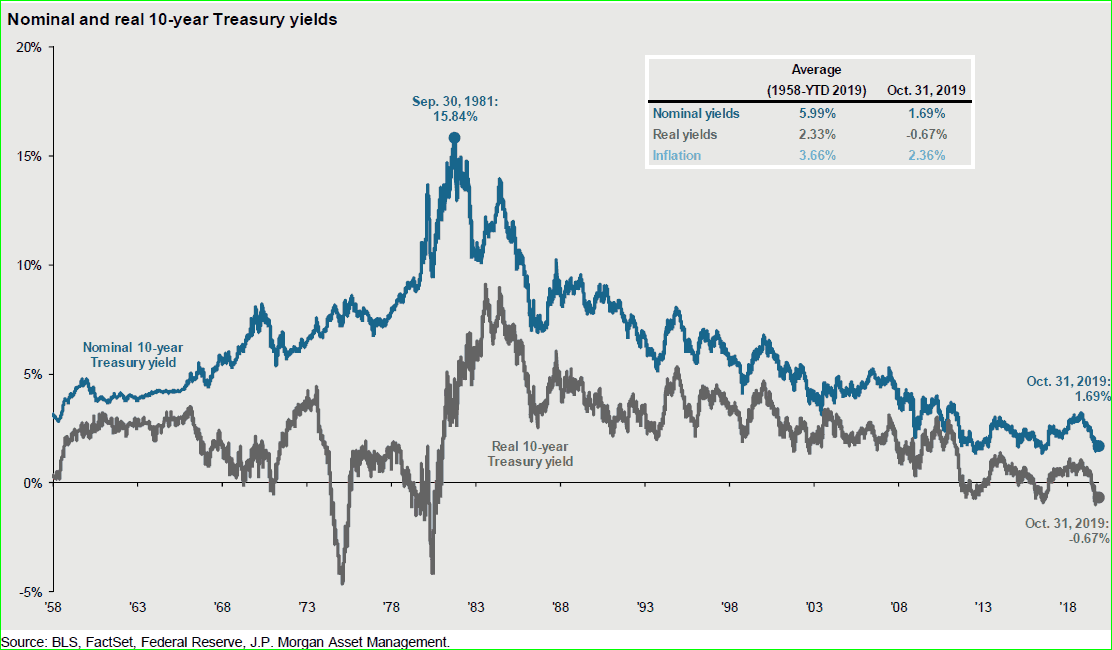
With interest rates across the globe near historic lows (Figure 3), central banks are nearing the limits of further policy accommodation to stimulate growth. The effects of monetary stimulus operate with a long 6 to 12 month lag and the main results will take time to filter through to the real economy. However, there are nascent signs of stabilization in the economic data and improving prospects for better growth in 2020 due to easier financial conditions.
U.S. Economy
The U.S economy has been steady as consumer spending remains strong and has offset the weakness in business spending and the manufacturing sector. Economic growth in the U.S. has downshifted from the 3% level to roughly 2% annual growth. For 2020, growth is expected to slow to 1.8%. The U.S. is better insulated from slowing global growth as exports only account for 8% of GDP. With dovish central banks and a robust consumer, the slowing economy is unlikely to turn into a recession in the U.S. over the next 6 to 12 months, absent an external shock. Additional supportive factors include: the labor market continuing to be firm and few signs of excess in cyclical sectors (autos, housing, and cap-ex) of the economy. We are closely watching the U.S. labor market and consumer confidence for signs that the global manufacturing slowdown is spreading to the consumer sector or beginning to bottom out.
Trade
Trade tensions have eased recently as U.S. and China are working to finalize a limited “Phase 1” trade deal. All existing tariffs remain in place with the next round of tariffs scheduled to go into effect in December. The Phase 1 trade deal is expected to include the suspension of the scheduled December round of tariffs. A future deal that addresses technology transfer and national security issues remains difficult and unlikely in 2020. The ongoing uncertainty from trade tensions will continue to dampen consumer/CEO confidence, slow business spending, and hurt global manufacturing. The rise of protectionism is a risk to global growth and argues for reducing risk in portfolio positioning.
Labor Markets
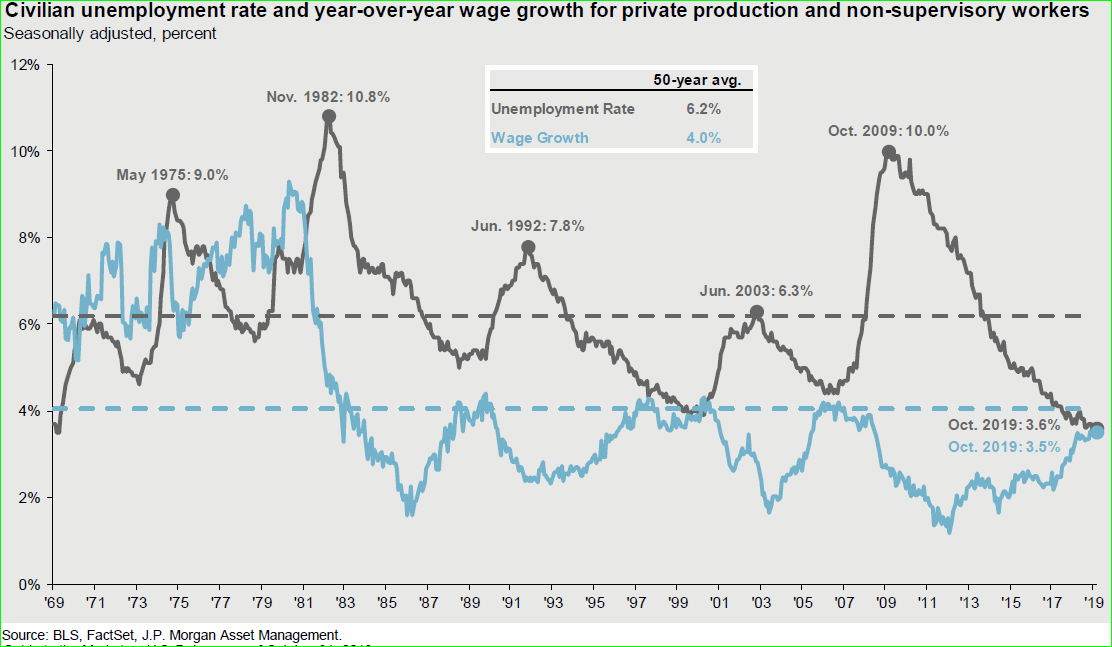
Employment growth has begun to slow but continues to be solid in a tight labor market. Wages are climbing 3.5% annually for non-supervisory workers, which is below the 4% rate that historically causes inflation issues. The unemployment rate is 3.6%, which is the lowest rate in fifty years (Figure 4). A strong labor market supports strong consumer spending, which is important as the consumer accounts for 68% of the U.S. economy.
Corporate Profits
Profit growth was very strong in 2018 (+20%) driven by tax reform and stronger U.S. growth. In 2019, the profit cycle has flattened to 1% year-over-year growth. Profits are likely to grow at a mid-single digit rate in 2020 aided by looser financial conditions and stabilizing global growth, but trade frictions and slowing China/overseas growth headwinds remain.
Valuations
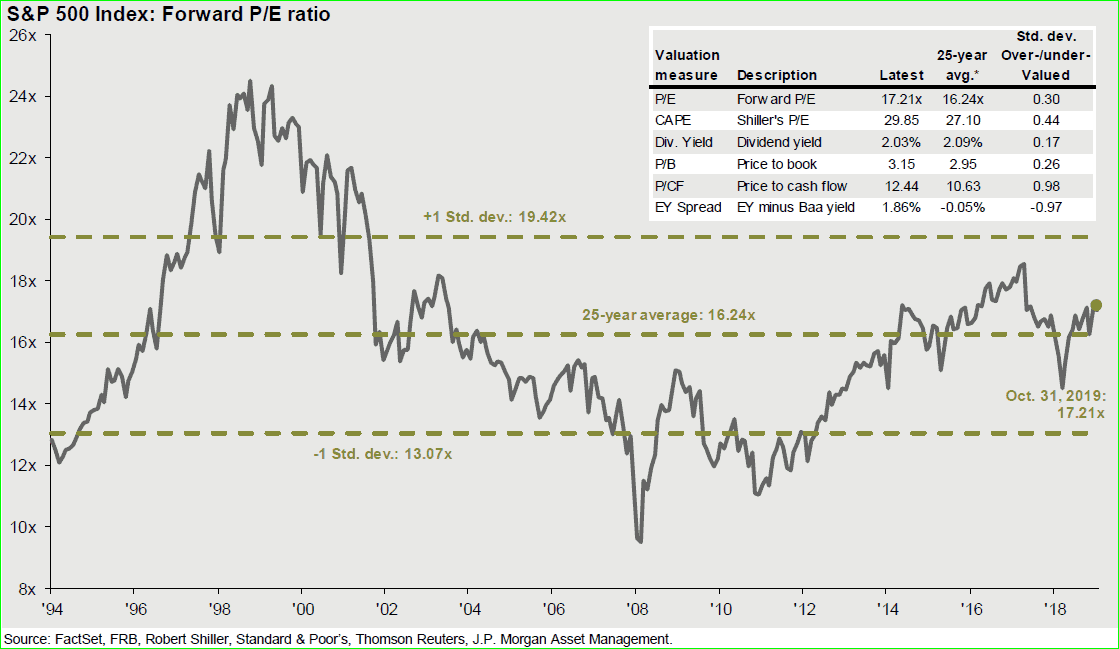
Lower global interest rates create higher demand for equities and support higher valuations. The forward operating price earnings ratio is 17.5 times earnings, which is above the 5-year historical average of 16.5 times earnings and the 25-year average of 16.2 times earnings (Figure 5). Overall, valuations are not inexpensive and higher equity prices will need to be driven by higher earnings.
Inflation
One of the big surprises in this long expansion has been the persistently low inflation, which remains well below the Fed’s 2% target. However, looking forward, there is the potential for inflation to rise in the U.S. due to the effects of tariffs and rising consumer wages, which may restrain the Fed from further easing.
Interest Rates
Interest rates have been very volatile in 2019 with the U.S. 10-year Treasury yield climbing over 3% in March and then plunging to 1.4% in the summer. Recently, the 10-Yr has rebounded to 1.80%. Importantly, with the Fed cutting short-term interest rates three times, the yield curve is no longer inverted. Overseas interest rates are putting downward pressure on U.S. rates as there are $12 trillion in negative yielding bonds. German 10-year now yields a negative 33 basis points (-0.33%). The Fed has signaled that it is on hold barring a sharp economic slowdown. Markets have tempered their expectations of further interest rate cuts by the Fed and are pricing in one cut in 2020 with 50/50 odds.
Outlook
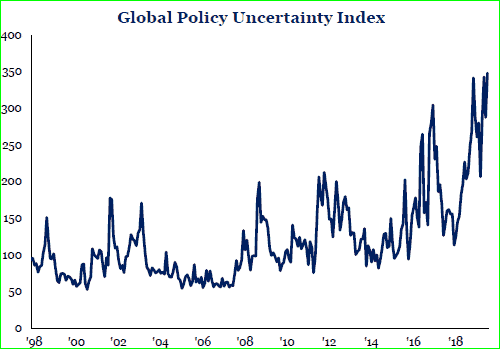
The combination of a late cycle backdrop with slowing global growth, geopolitical tensions, and an aging expansion, leads us to a more balanced allocation in our portfolio construction emphasizing resilience and flexibility. Geopolitical frictions and macro uncertainties (Figure 6) remain elevated at a time that asset prices for stocks and bonds are near highs. U.S. growth is slowing, yet there are few signs of overheating or financial bubbles/imbalances that have historically been the catalysts that end expansions. The global dovish shift in monetary policy by global central banks toward lower interest rates with likely stabilize growth over the next 6 to 9 months, lengthening the already long expansion.
We keep at overweight in U.S. equities and our overall equity allocation at neutral. We have increased liquidity and quality in our fixed income allocation. This is a continuation over the last 12 to 18 months toward less risk, higher quality, and greater liquidity in our asset allocation positioning.
INVESTMENT IMPLICATIONS: Portfolio Positioning
Against the backdrop of a late cycle environment, slower global growth, higher macro uncertainties, and asset prices that are elevated, we are sticking close to our long-term strategic target allocations. We have moved to a more balanced portfolio positioning by reducing our overweight in stocks to neutral and increasing our bond allocation over the last 12 months. We emphasize flexibility and portfolio resilience to structure portfolios that can prosper in a wide range of economic and market scenarios. We remain positive on U.S. equities and have increased allocations due to stronger U.S. economic growth, corporate
earnings, and policy.
In fixed income, we are focused on the U.S. and are avoiding international bonds due to lower interest rates where $12 trillion of investment grade bonds have negative interest rates. We have increased allocation to quality investment grade bonds and reduced credit sector allocations due to tight corporate spreads and late cycle concerns where credit sector risk increases. We continue to incorporate diverse asset classes including gold, short-term investments, investment grade bonds, alternatives, and cash that act as portfolio diversifiers and provide liquidity.
In a late cycle environment with low interest rates, forward looking asset class returns are lower than historical averages. Volatility across asset classes remains near historically low levels and will likely rise over time. Our dynamic asset allocation continues to be additive to returns, while continuing the construction of diversified, high quality global portfolios.
MARKET RECAP (October 31, 2019):
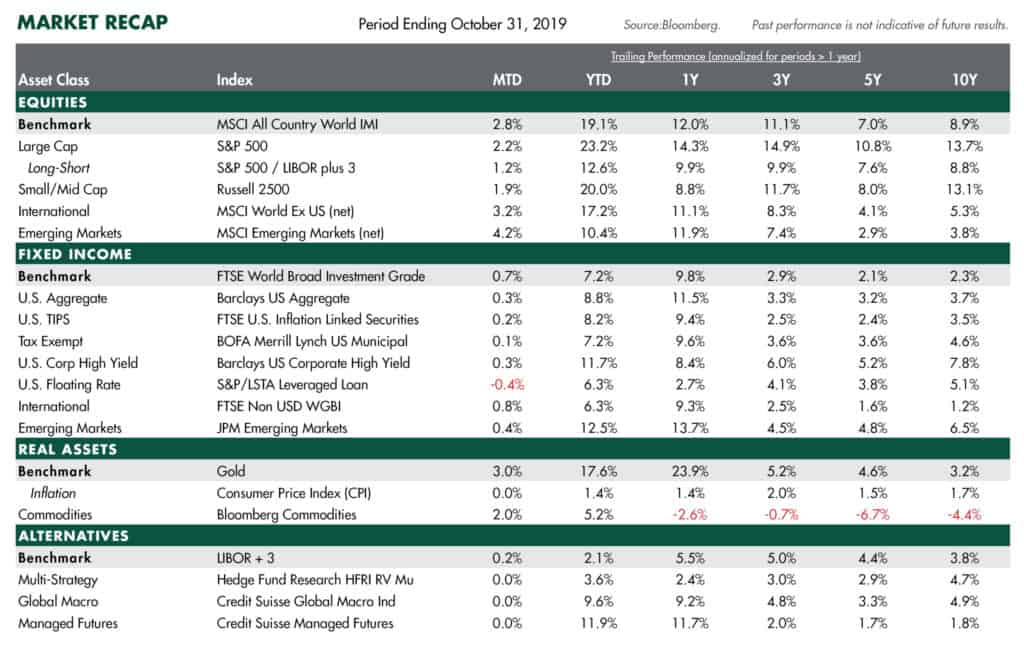
- In 2019, the broad asset classes have posted strong gains; the best in a decade. Year-to-date, U.S. equities have led as the S&P 500 has gained 23.2%. The U.S. outperformed international stocks as international developed equities gained 17.2% and emerging market equities rose 10.4%. Both held back by a stronger U.S. dollar, weaker growth, and higher exposure to trade tensions due to higher exports.
- The yield on the 10-Yr. U.S. Treasury bond yields dropped sharply to 1.80% after being above 3% earlier in the year. In the bond credit sector, floating rate loans and high yield have gained 6.3% and 11.7%, respectively. Credit spreads remain very tight across the credit sector as defaults remain low and relative yields are attractive.
- WTI oil prices have risen $10 year-to-date to $55 per barrel. Commodities are higher by 5% for the year.
- Gold has broken out to the upside on rising geopolitical concerns and is 17% higher for the year. Year-to-date, alternatives posted solid returns in the fixed income surrogate segment.
Related Articles