Join our investment team for a look at this quarter's insights into the markets and the economy.
Content by Greg Berg – Senior Vice President & Senior Portfolio Manager
Video by Matthew Suarez, Vice President & Portfolio Manager
CLICK HERE TO DOWNLOAD THE PDF VERSION OF OUR NEWSLETTER.
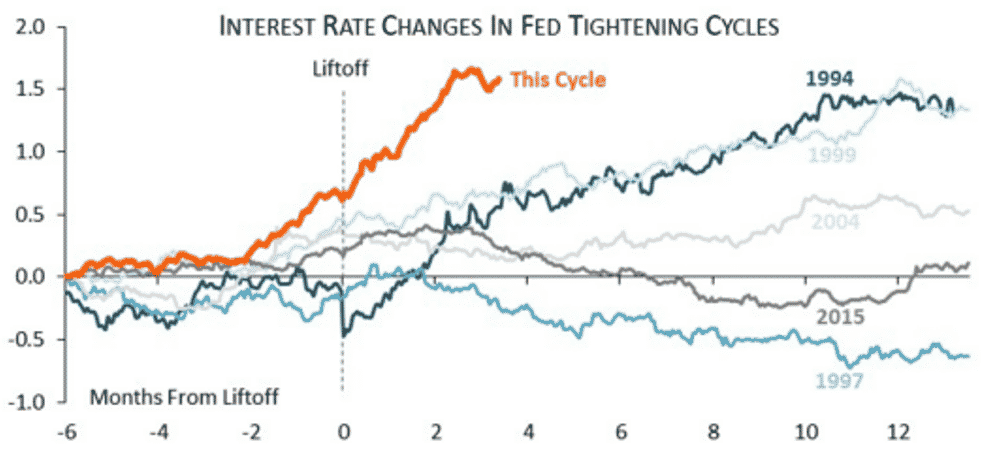
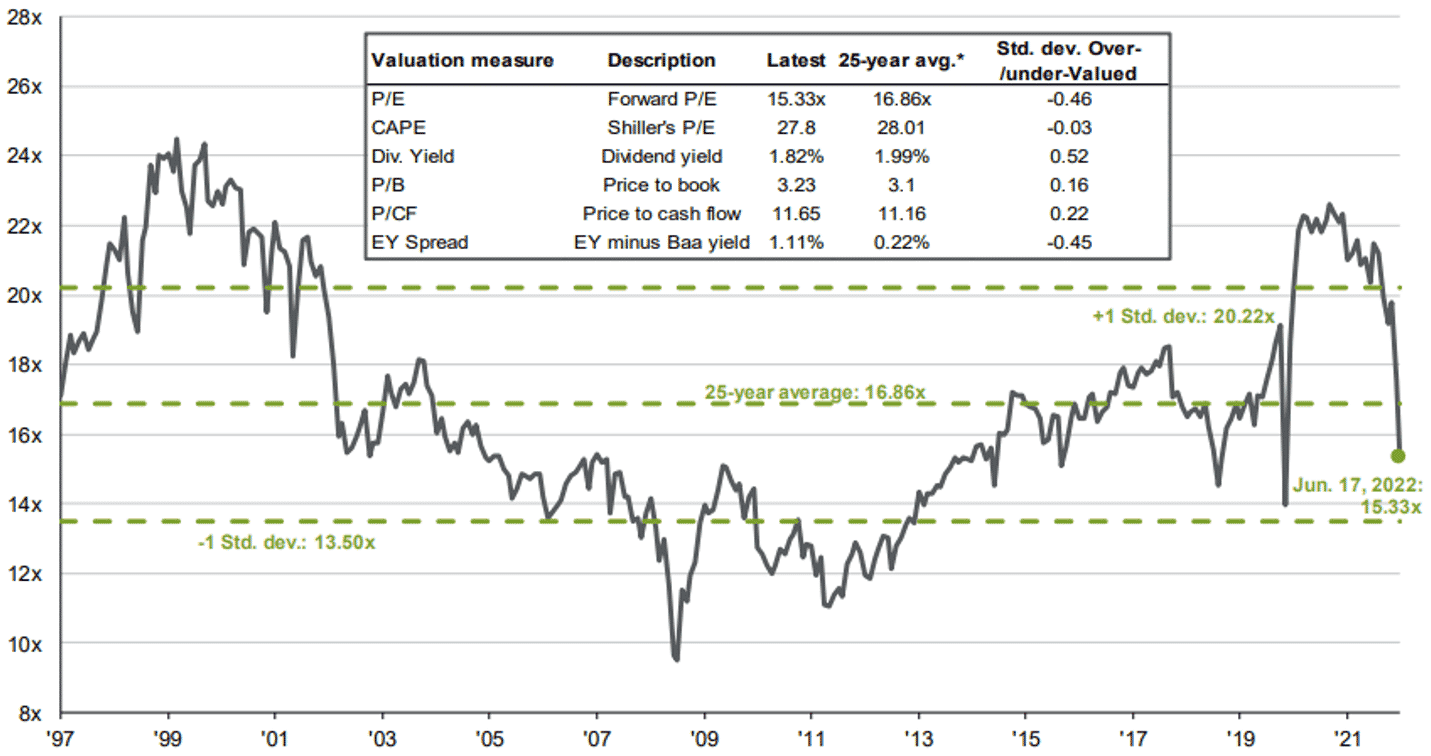
The combination of substantially tighter U.S. monetary policy (Figure 1), rising inflation, the ongoing Ukraine war, and a Covid-19 lock down in China all weighed on investor sentiment and capital markets in the second quarter. Stock markets have entered into bear market territory (a 20% decline). The S&P 500 index is lower by 21% year-to-date, while the technology heavy NASDAQ Index is lower by 32% for the year. Bonds yields have jumped due to inflation and Fed tightening, which has led to a negative 12% return in the Aggregate Bond Index year-to-date. A 60/40 stock-bond portfolio is lower by 18% year-to-date, which is the worst start to a year in a century. Markets are pricing in aggressive rate increases, slowing growth and a higher probability of a recession in the next 6-12 months. On a positive note, valuation levels have moderated to 15 times forward earnings, compared to the 25-year average of 16.8 times (Figure 2).
HIGHLIGHTS
- We have entered a regime change from free money/ quantitative easing with zero interest rates to quantitative tightening with rising interest rates and less liquidity.
- Inflation is likely to remain elevated due to supply shocks, de-globalization, tight energy markets, and labor shortages.
- Post-WWII, there have been 14 Federal Reserve rate hike cycles. The economy landed in a recession in 11 of the 14 rate hiking periods. The economy’s growth rate is rapidly decelerating toward the 1% level and the probability of recession continues to increase.
- We are cautious near-term, as supply constraints and inflation persist, and markets digest the Fed’s aggressive monetary tightening.
REDUCED GLOBALIZATION AND FUTURE INFLATION
The rise in globalization in the 1990s (NAFTA, China WTO) led to a disinflationary trend with higher growth. Globalization has begun to contract as the pandemic has brought supply chains closer to home. The U.S. was moving away from China pre-pandemic and now Europe and the West are decoupling from Russia due to the horrific war in Ukraine. The trend toward de-globalization will drive inflation higher, require investments in new supply chains, and lower global growth and profitability.
INFLATION AND THE FED
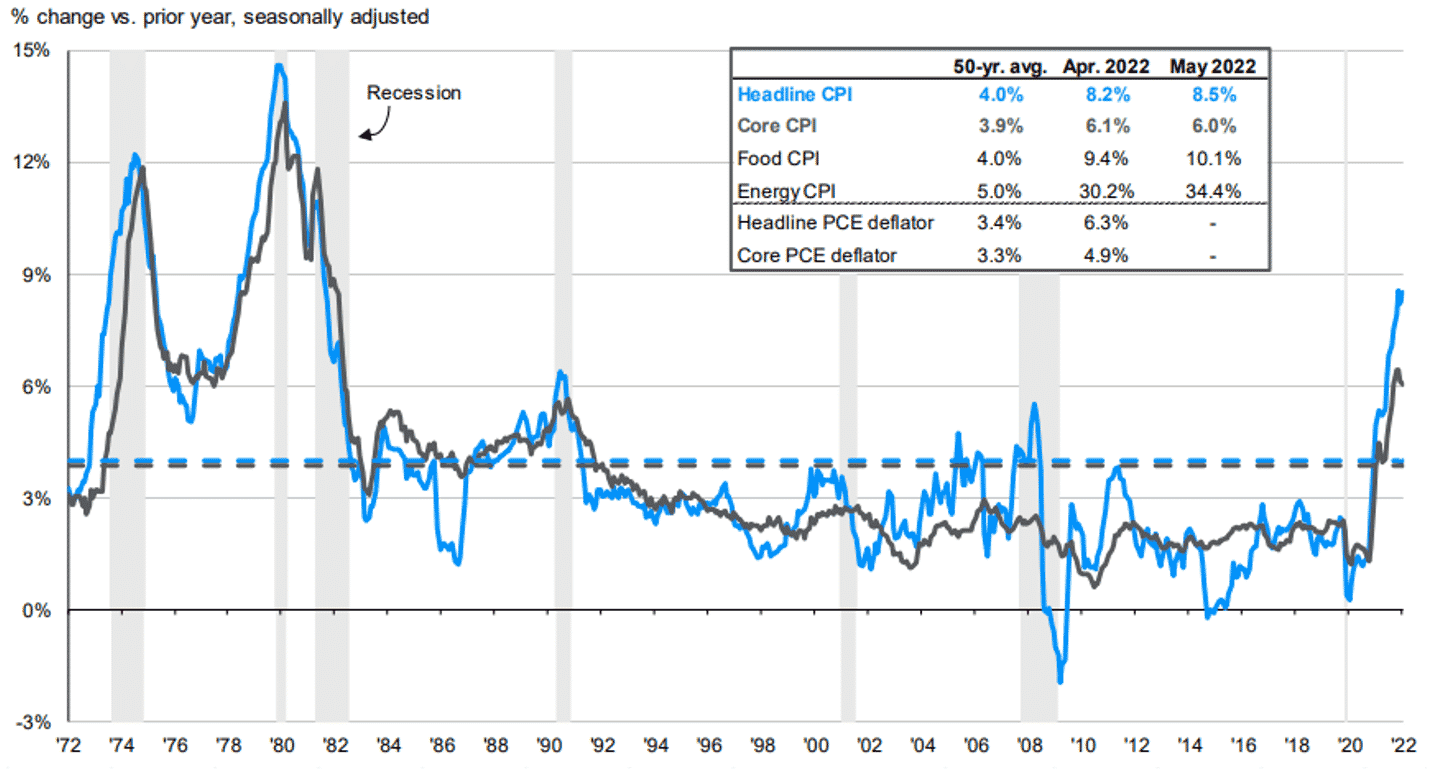
Inflation is at 40-year highs (Figure 3) due to the exogenous supply shocks from the pandemic and the Ukraine war, coupled with overheated demand from the economic reopening and fiscal stimulus. The Fed (and other central banks) is in a bind and must manage the trade-off between growth and inflation. Hiking rates too aggressively will risk a recession, while not tightening policy enough could cause inflation to become embedded in the economy.
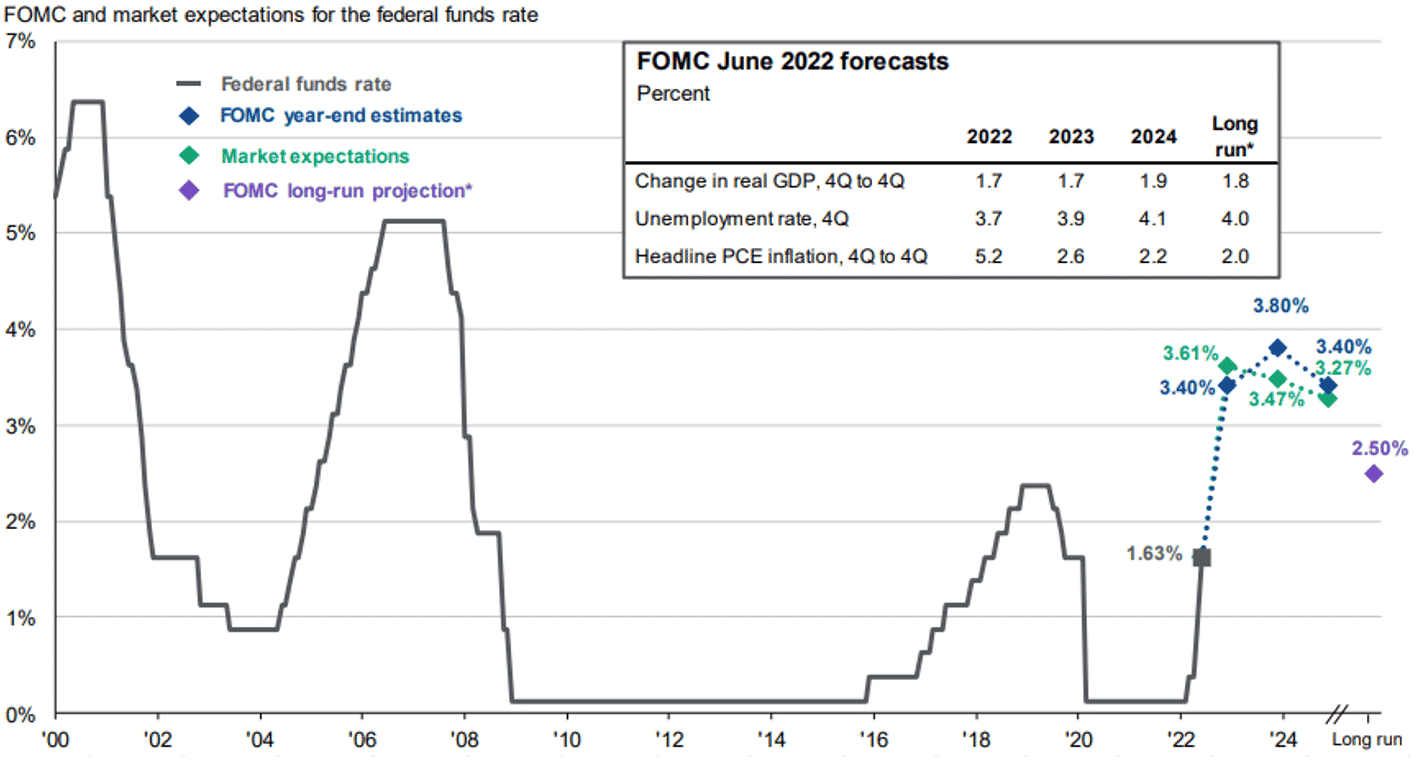
We have entered a regime change away from free money/quantitative easing with zero interest rates to quantitative tightening with rising interest rates and less liquidity. The Fed is just beginning to normalize monetary policy after having pegged short term interest rates at zero for an extended period. The Fed hiked short-term rates 0.75% in June and will likely increase another 0.75% in July, while at the same time beginning to shrink its balance sheet. The market has priced in a rapid increase in short-term rates to approximately 3.40% by year-end and nearly 4.0% in 2023 (Figure 4). The Fed has made it clear it intends to slow demand and growth to steer inflation towards its 2% goal. A key question is whether the Fed can lower inflation to its 2% target without causing a recession.
FED RATE HIKE CYCLES
Since World War II, there have been 14 periods where the Federal Reserve has embarked on a rate hike cycle. In 11 of those periods, the economy landed in recession. The other three instances ended in a “soft-landing”, where growth slows, demand cools, and inflation comes down, but the economy avoids a recession. This is the goal of the Federal Reserve. In the three prior soft-landing periods, there were macro factors that offset the Fed rate tightening, including higher fiscal
spending (mid-1960s), a 60% decline in oil prices (mid-1980s), and a jump in productivity (mid-1990s). However, today these factors aren’t present as fiscal stimulus has ended, oil prices are up 200% in little over a year, and productivity growth is flat. Using history as a guide, there is a one in five chance that the current rate hike cycle will not end in a recession.
BEAR MARKETS
The threshold for a bear market is a decline of 20% in the stock market. NASDAQ and the S&P 500 have both had a decline of 20% or more this year. The average bear market post-WWII had a 34% peak-to-trough drawdown (with a range of -20% to -50%) and lasts an average of 15 months.
A question for investors is whether the current bear market will be followed by a recession. Not all bear markets precede recessions, but all recessions are preceded by bear markets. Bear markets that precede recessions tend to be longer (449 days versus 198 days) and steeper (-35.0% versus -28.2%) than bear markets that don’t. The combination of a Fed tightening cycle and the U.S. stock market entering into bear market territory increases the odds that a recession will occur within the next 6 to 12 months.
RECESSIONS AND GROWTH
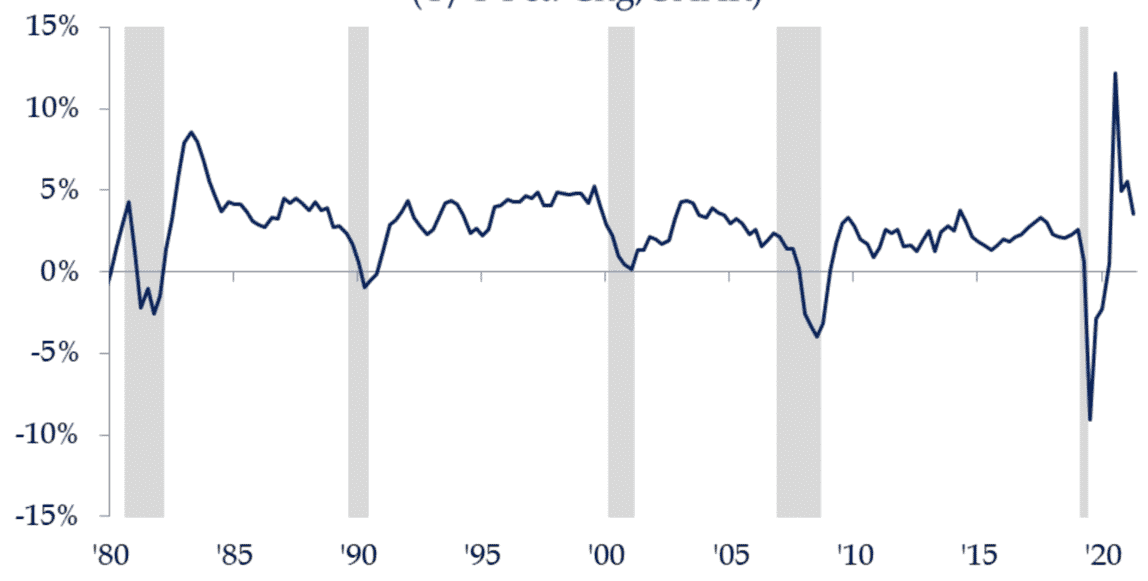
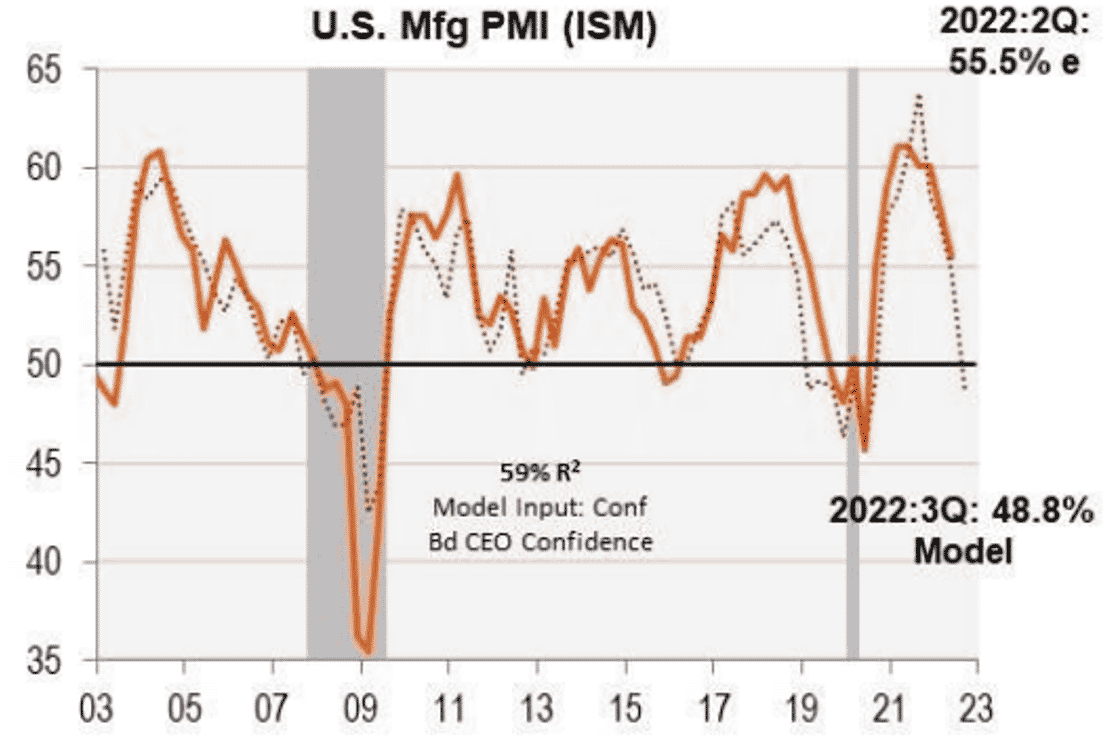
In the U.S., there have been 14 recessions post-WWII. The median length is 9 months and the median peak-to-trough decline in the S&P 500 is 23.9%. Markets are forward looking, as the S&P 500 tends to peak before the recession starts and bottom, on average, four months before the recession ends. Once the S&P 500 reaches the bottom, the returns over the next 12 months are about 46%. Therefore, the good news is once the stock market finally does bottom, the rebounds tend to be sharp over the next 12 months. The economy is in the later stages of expansion. Growth is slowing rapidly from above-trend growth, and is increasingly vulnerable to downward revisions as monetary policy tightens and fiscal support wanes (Figure 5 and Figure 6). Our base case for 2022 is for a marked slowdown in growth to around 1% in the second half of the year with rising odds of a recession in early 2023.
LOOKING FORWARD
We are cautious near-term as supply constraints and inflation persist, and markets digest the Fed’s aggressive monetary tightening. Entering 2022, we reduced our equities overweight to neutral and raised cash and short-term fixed income holdings, expecting heightened volatility as the Fed raises interest rates and supply shocks persist. Risks to growth are skewed to the downside due to elevated inflation, monetary tightening, high debt levels, slowing growth, and geopolitical uncertainties. We expect inflationary pressures to moderate, yet remain elevated above pre-pandemic levels, as supply constraints persist and the trend away from
globalization continues.
INVESTMENT IMPLICATIONS: PORTFOLIO POSITIONING
In an uncertain macro environment, there is a wide range of outcomes and the possibility of abrupt changes in the macro landscape. Tactically, we are neutral on stocks and stay underweight government bonds and duration as interest rates move higher. Portfolio diversifiers are important in hedging downside risks and providing flexibility and liquidity. Inflation-linked bonds, commodities, and gold provide a hedge against inflation surprises and excessive monetary creation. We have cash and short-term fixed income investments to minimize the risk of rising yields and to take advantage of opportunities.
In equities, we are overweight U.S. equities, preferring the U.S. over international developed markets given their geographical proximity to Ukraine and greater economic linkages (energy, supply chains) to Russia and Ukraine. We are overweight large cap U.S. equities, emphasizing the quality factor, due to their strong balance sheets and profit margins in a period of slowing growth. We have lowered our exposure to emerging markets due to their higher vulnerability to higher costs of energy and food, and exposure to China.
In fixed income, we remain underweight duration, as we see yields climbing higher due to inflation, tightening monetary policy, and increasing government bond supply. We prefer U.S. investment grade bonds that have relatively higher yields, providing greater ballast for portfolios to hedge equity risk. We remain overweight inflation-linked bonds (TIPS), which are high quality U.S. government bonds that hedge against rising inflation expectations. In the credit sector, we have reduced exposure in the economic late cycle and prefer floating rate loans that benefit from rising interest rates.
In an environment with historically low interest rates and evaluated equity valuations, forward-looking expected asset class returns are lower than historical averages. We expect market volatility to persist due to monetary tightening, higher inflation/interest rates, supply shocks and geopolitical risks. Overall, our dynamic tactical asset allocation continues to enhance returns and reduce risk.
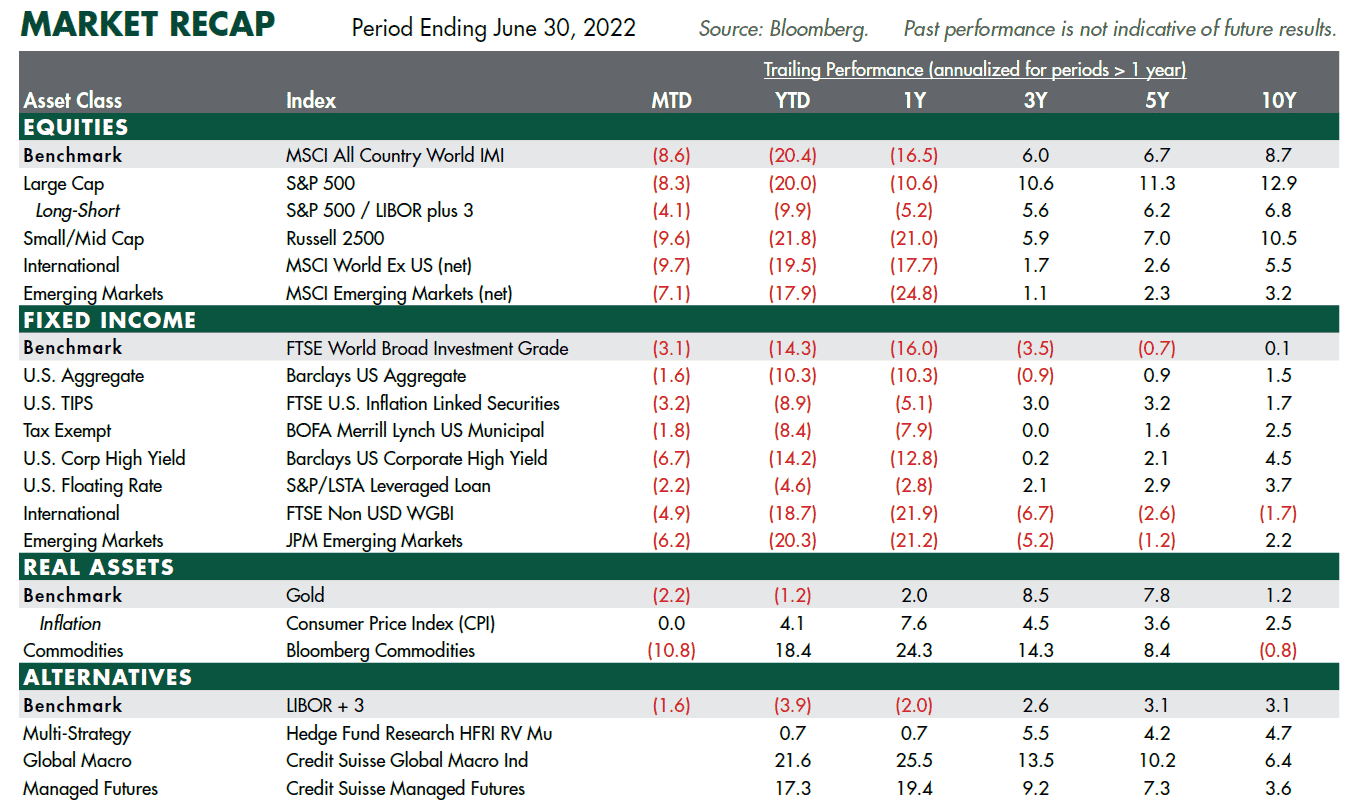
MARKET RECAP (JUNE 30, 2021):
- The first half of 2022 was difficult for investors as both global stocks and bonds had significant losses with only energy and commodities posting strong gains.
- The U.S. stock market made a record high in early January before a hawkish Fed tightening pivot and the Russia invasion led to a sharp drop into bear market territory. Year-to-date, the S&P 500 declined 20.0%, the worst first half since 1970. Global stock markets were also weak as international equities and emerging markets declined 19.5% and 17.9%, respectively. Style-wise, Value trumped the Growth style by a wide margin (1500 basis points).
- Bond indices experienced widespread price declines as yields roughly doubled on the 10-Year U.S. Treasury that hit a peak of 3.5%, the highest level since 2011. Global bonds fell 14.3% and the Barclays Aggregate Bond Index declined 10.3%. Credit spreads widened significantly.
- Gold declined 1.2%. WTI oil prices jumped 46% higher after reaching a 14-year high over $125 per barrel. Commodities surged 18% due to pent-up demand coinciding with supply constraints.
- In Alternatives, fixed income substitutes outperformed traditional bond indices and inflation/commodity-oriented alternatives posted strong returns.
Related Articles